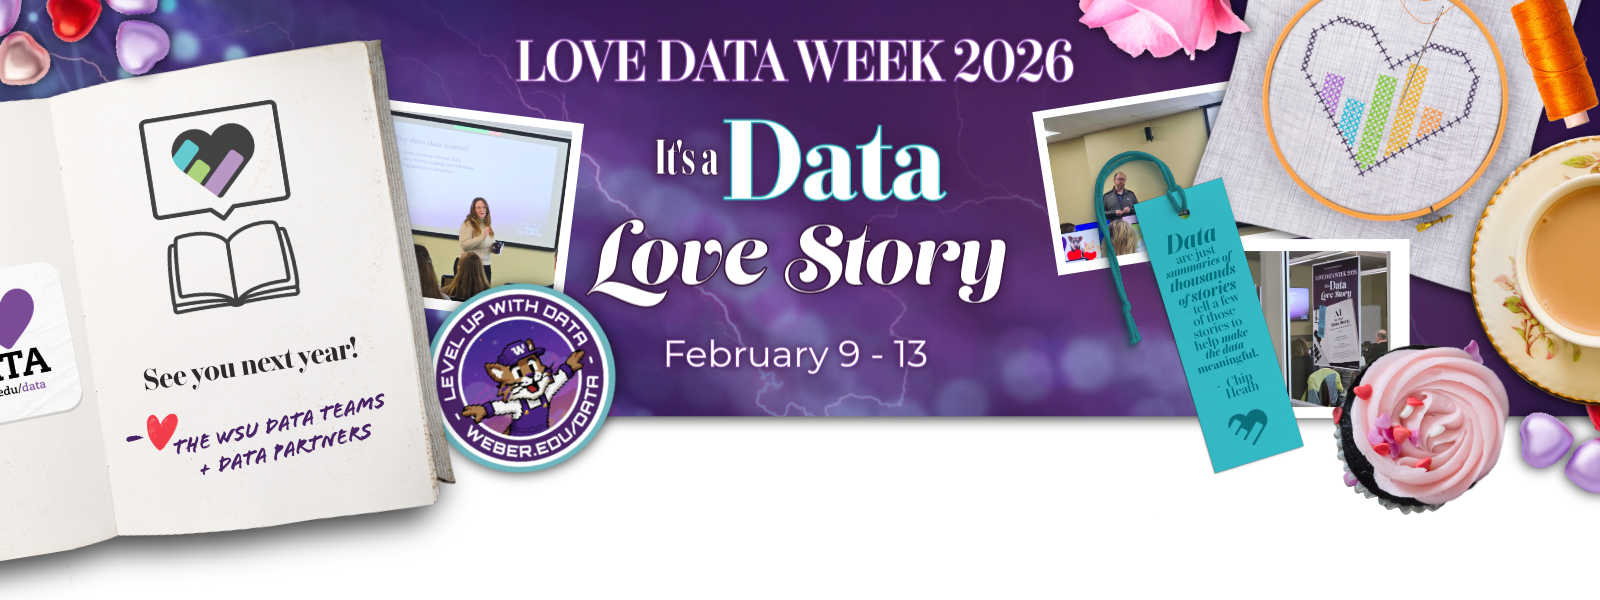
Thanks for being part of Love Data Week 2026!
The Weber State Data Teams and our data partners loved sharing Love Data Week: It's a Data Love Story with you! Building on the momentum from the 2025 Data Summit, we explored data tools, resources, and strategies to support student success, engagement, and belonging. From hands-on Excel sessions to creating relationships (and data cross stitches) to Report Gallery dashboard deep-dives, it was a week full of connection and discovery.
Your engagement helps keep the spark of Weber State’s data culture alive, and the learning doesn’t have to end here! Below, you’ll find links to additional resources and the week's presentations (login required) to keep the data love flowing.
💘 Epilogue:
- Continue the Conversation: Take our survey to let us know how we did and suggest topics for future sessions.
- Explore: Visit weber.edu/data to learn more about the reports, dashboards and training resources the Weber State Data Teams have to offer.
- Attend: The Weber State Data Teams host in-person and online trainings throughout the year. Check out upcoming trainings.
- Reach out: If you have questions about data resources, department-specific training, or dashboards don't hesitate to get in touch with the Weber State Data Teams via ossa@weber.edu or data@weber.edu.
📊 Data Viz Winners:
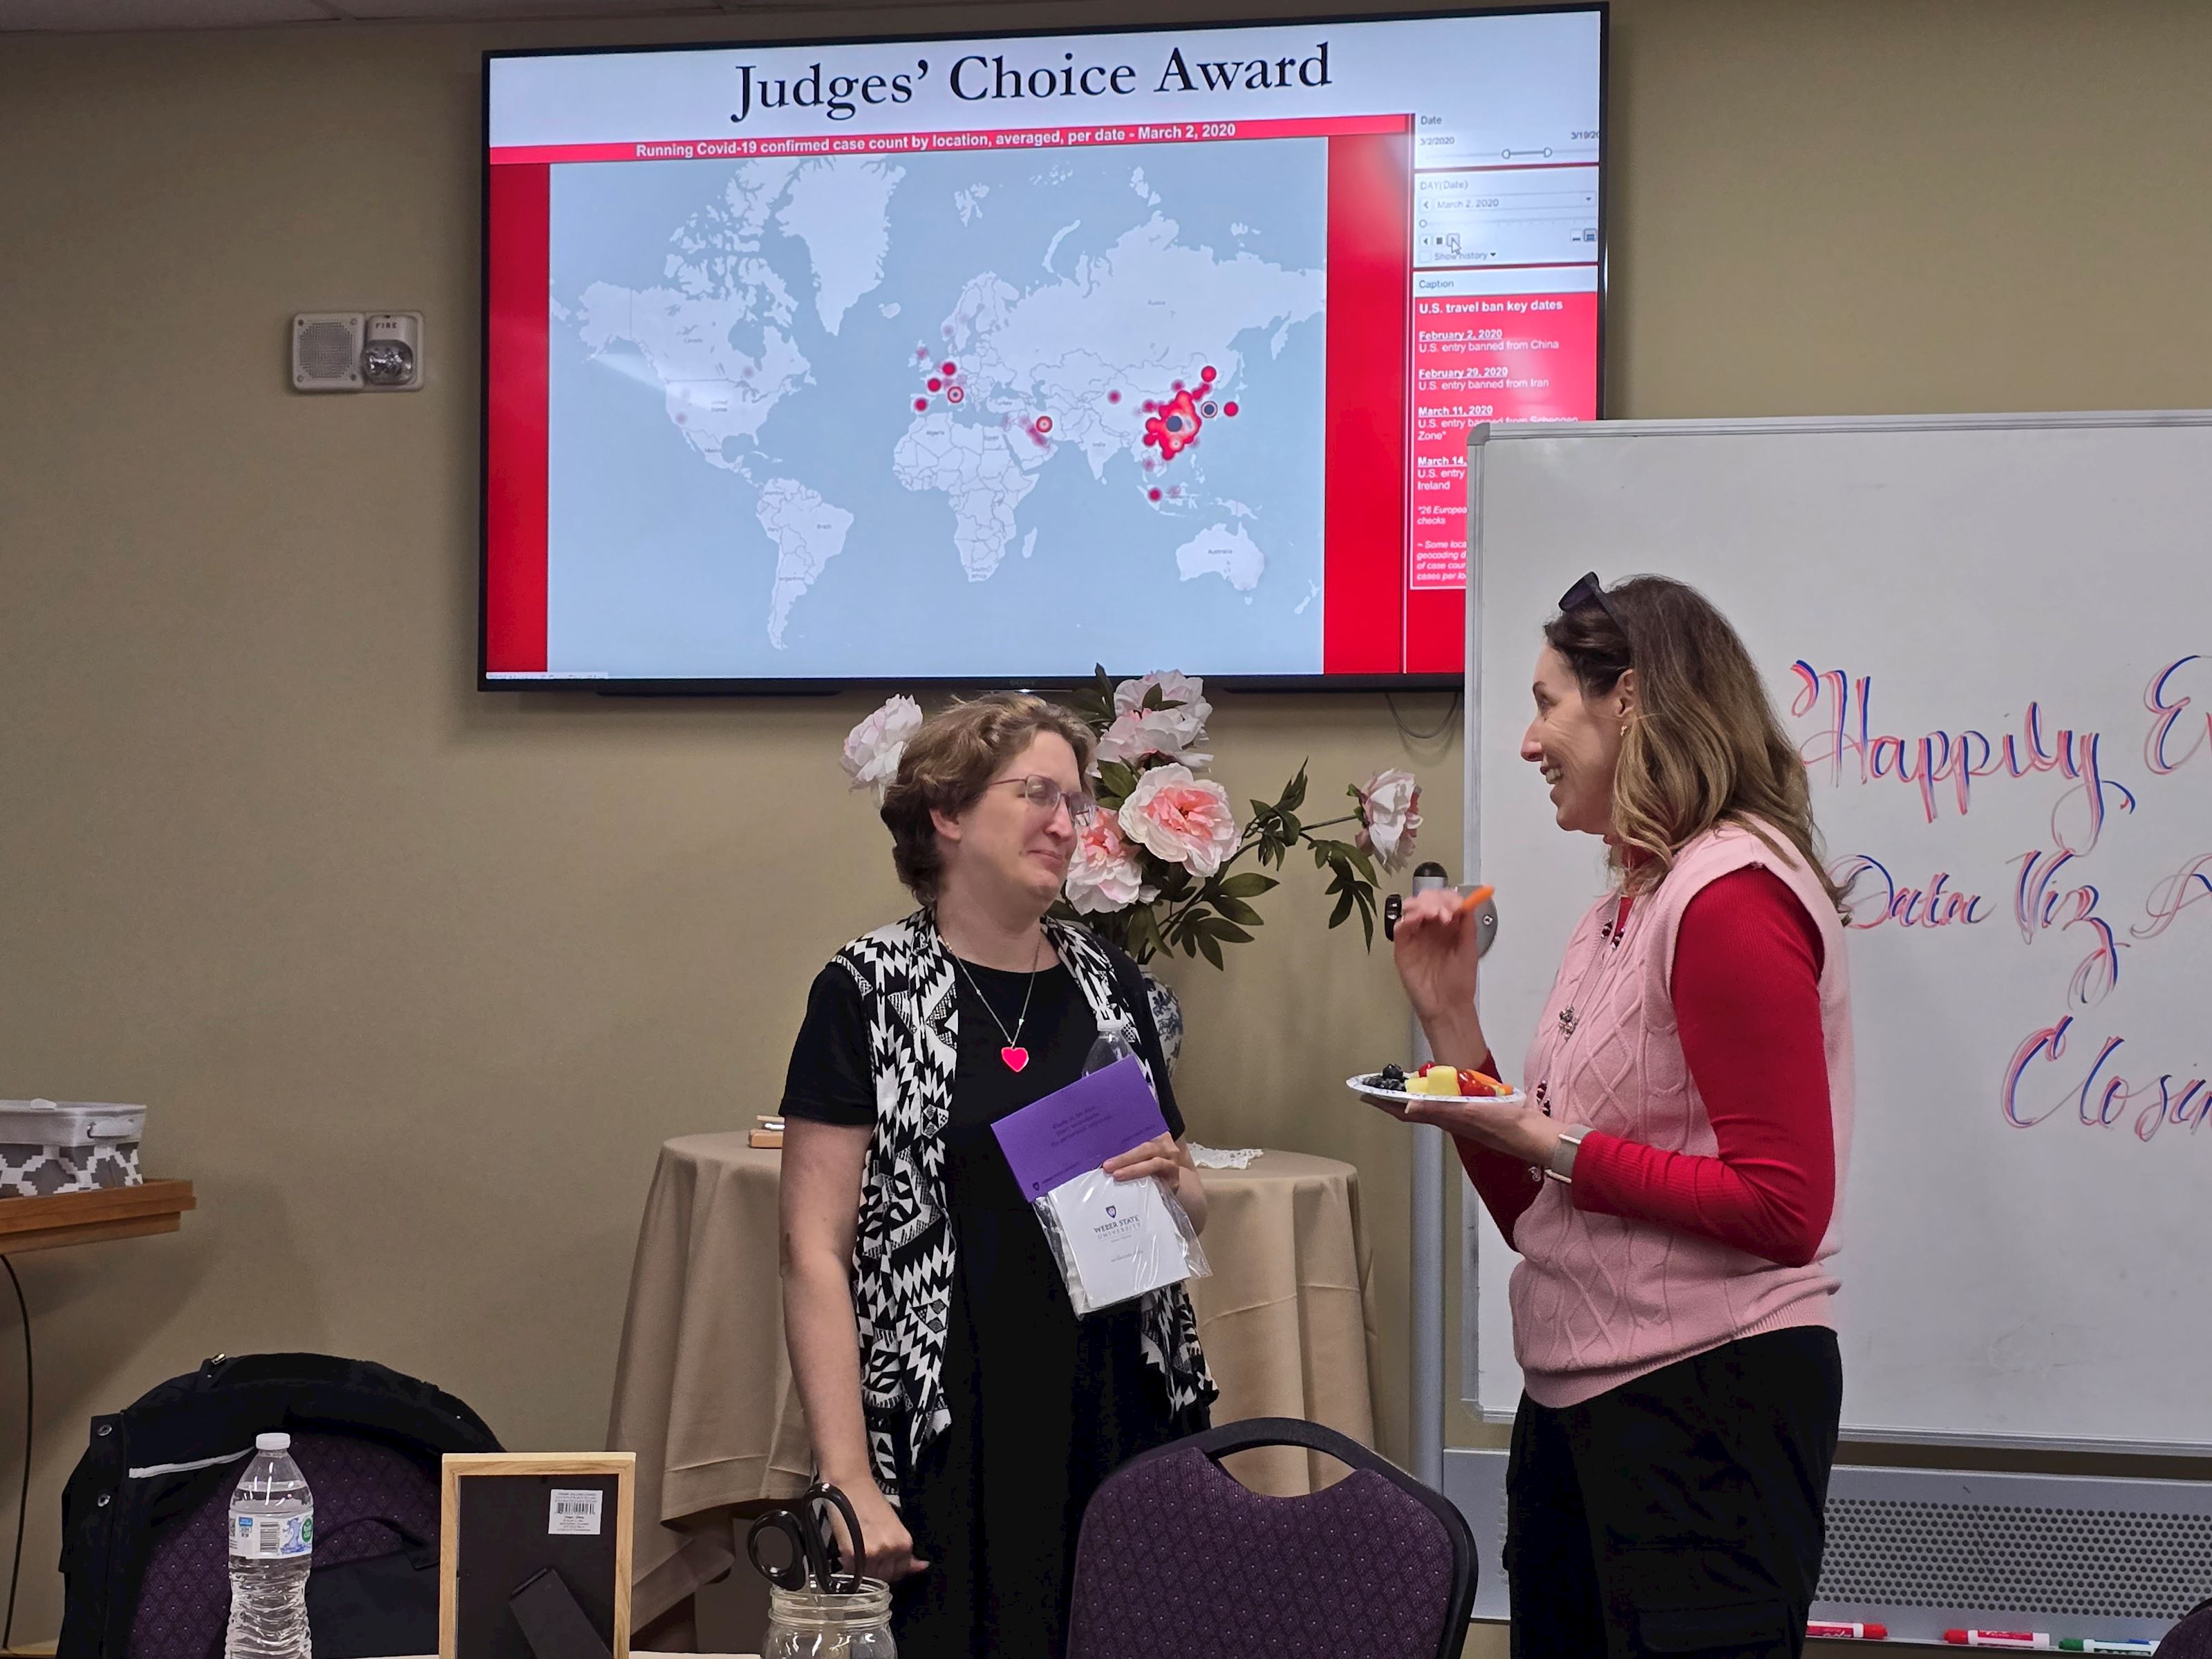
Thank you to everyone who shared their Data Love Story for our Data Visualization Contest, and congratulations to our winners!
Judges' Choice Award
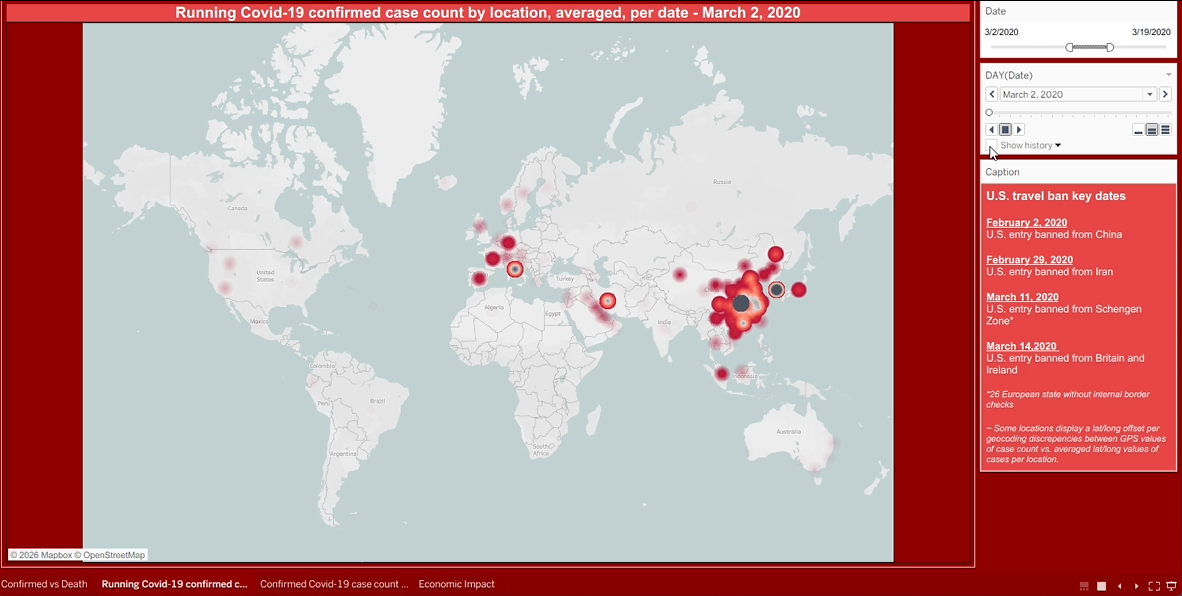
Dave Taylor
The American Introduction to Covid-19
People's Choice Award
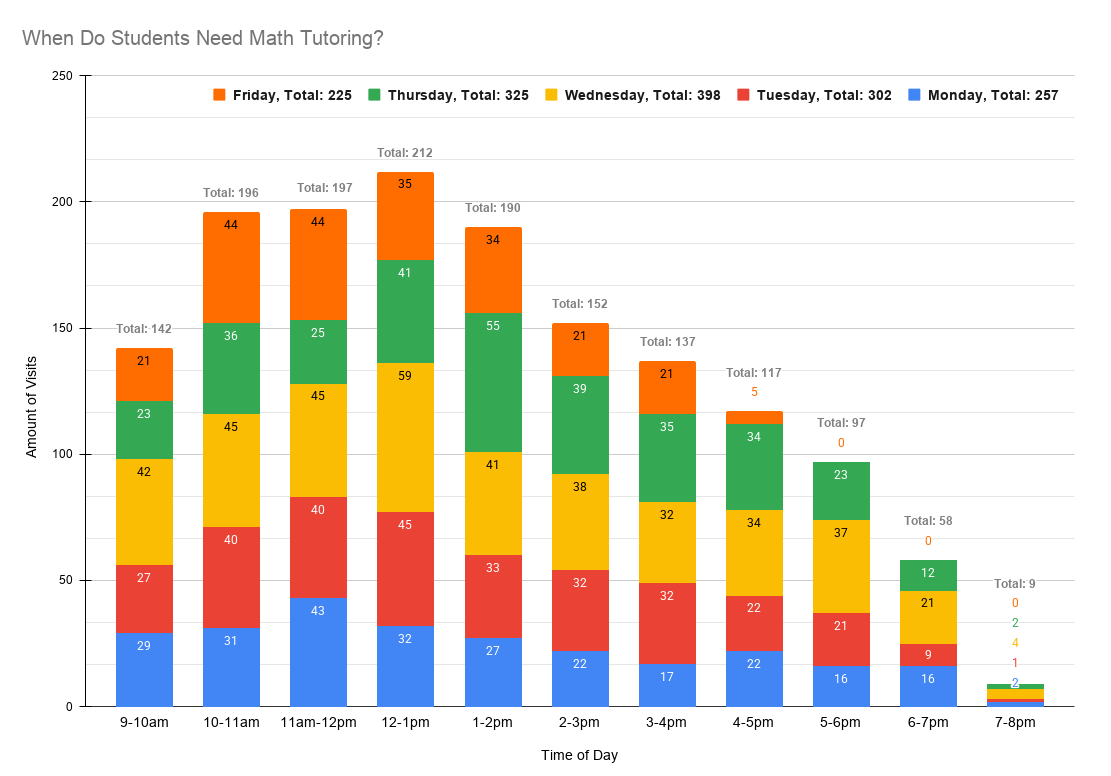
Juliana Oldham
Math Tutoring Center Fall 2025 Visits by Day of Week and Time of Day
| Date & Time | Format | Title & Short Description |
|---|---|---|
| Monday, Feb 9, 2026
10:00 - 11:30 am |
Presentation & Workshop |
Your First Chapter in Data: Navigating and Using WSU ResourcesLearn the basics of WSU’s data ecosystem, including where to find institutional data, how to request it responsibly, and how to frame role-appropriate data questions for effective decision-making. Session Assets: Presentation Deck |
| Monday, Feb 9, 2026
12:30 - 2:00 pm |
Workshop |
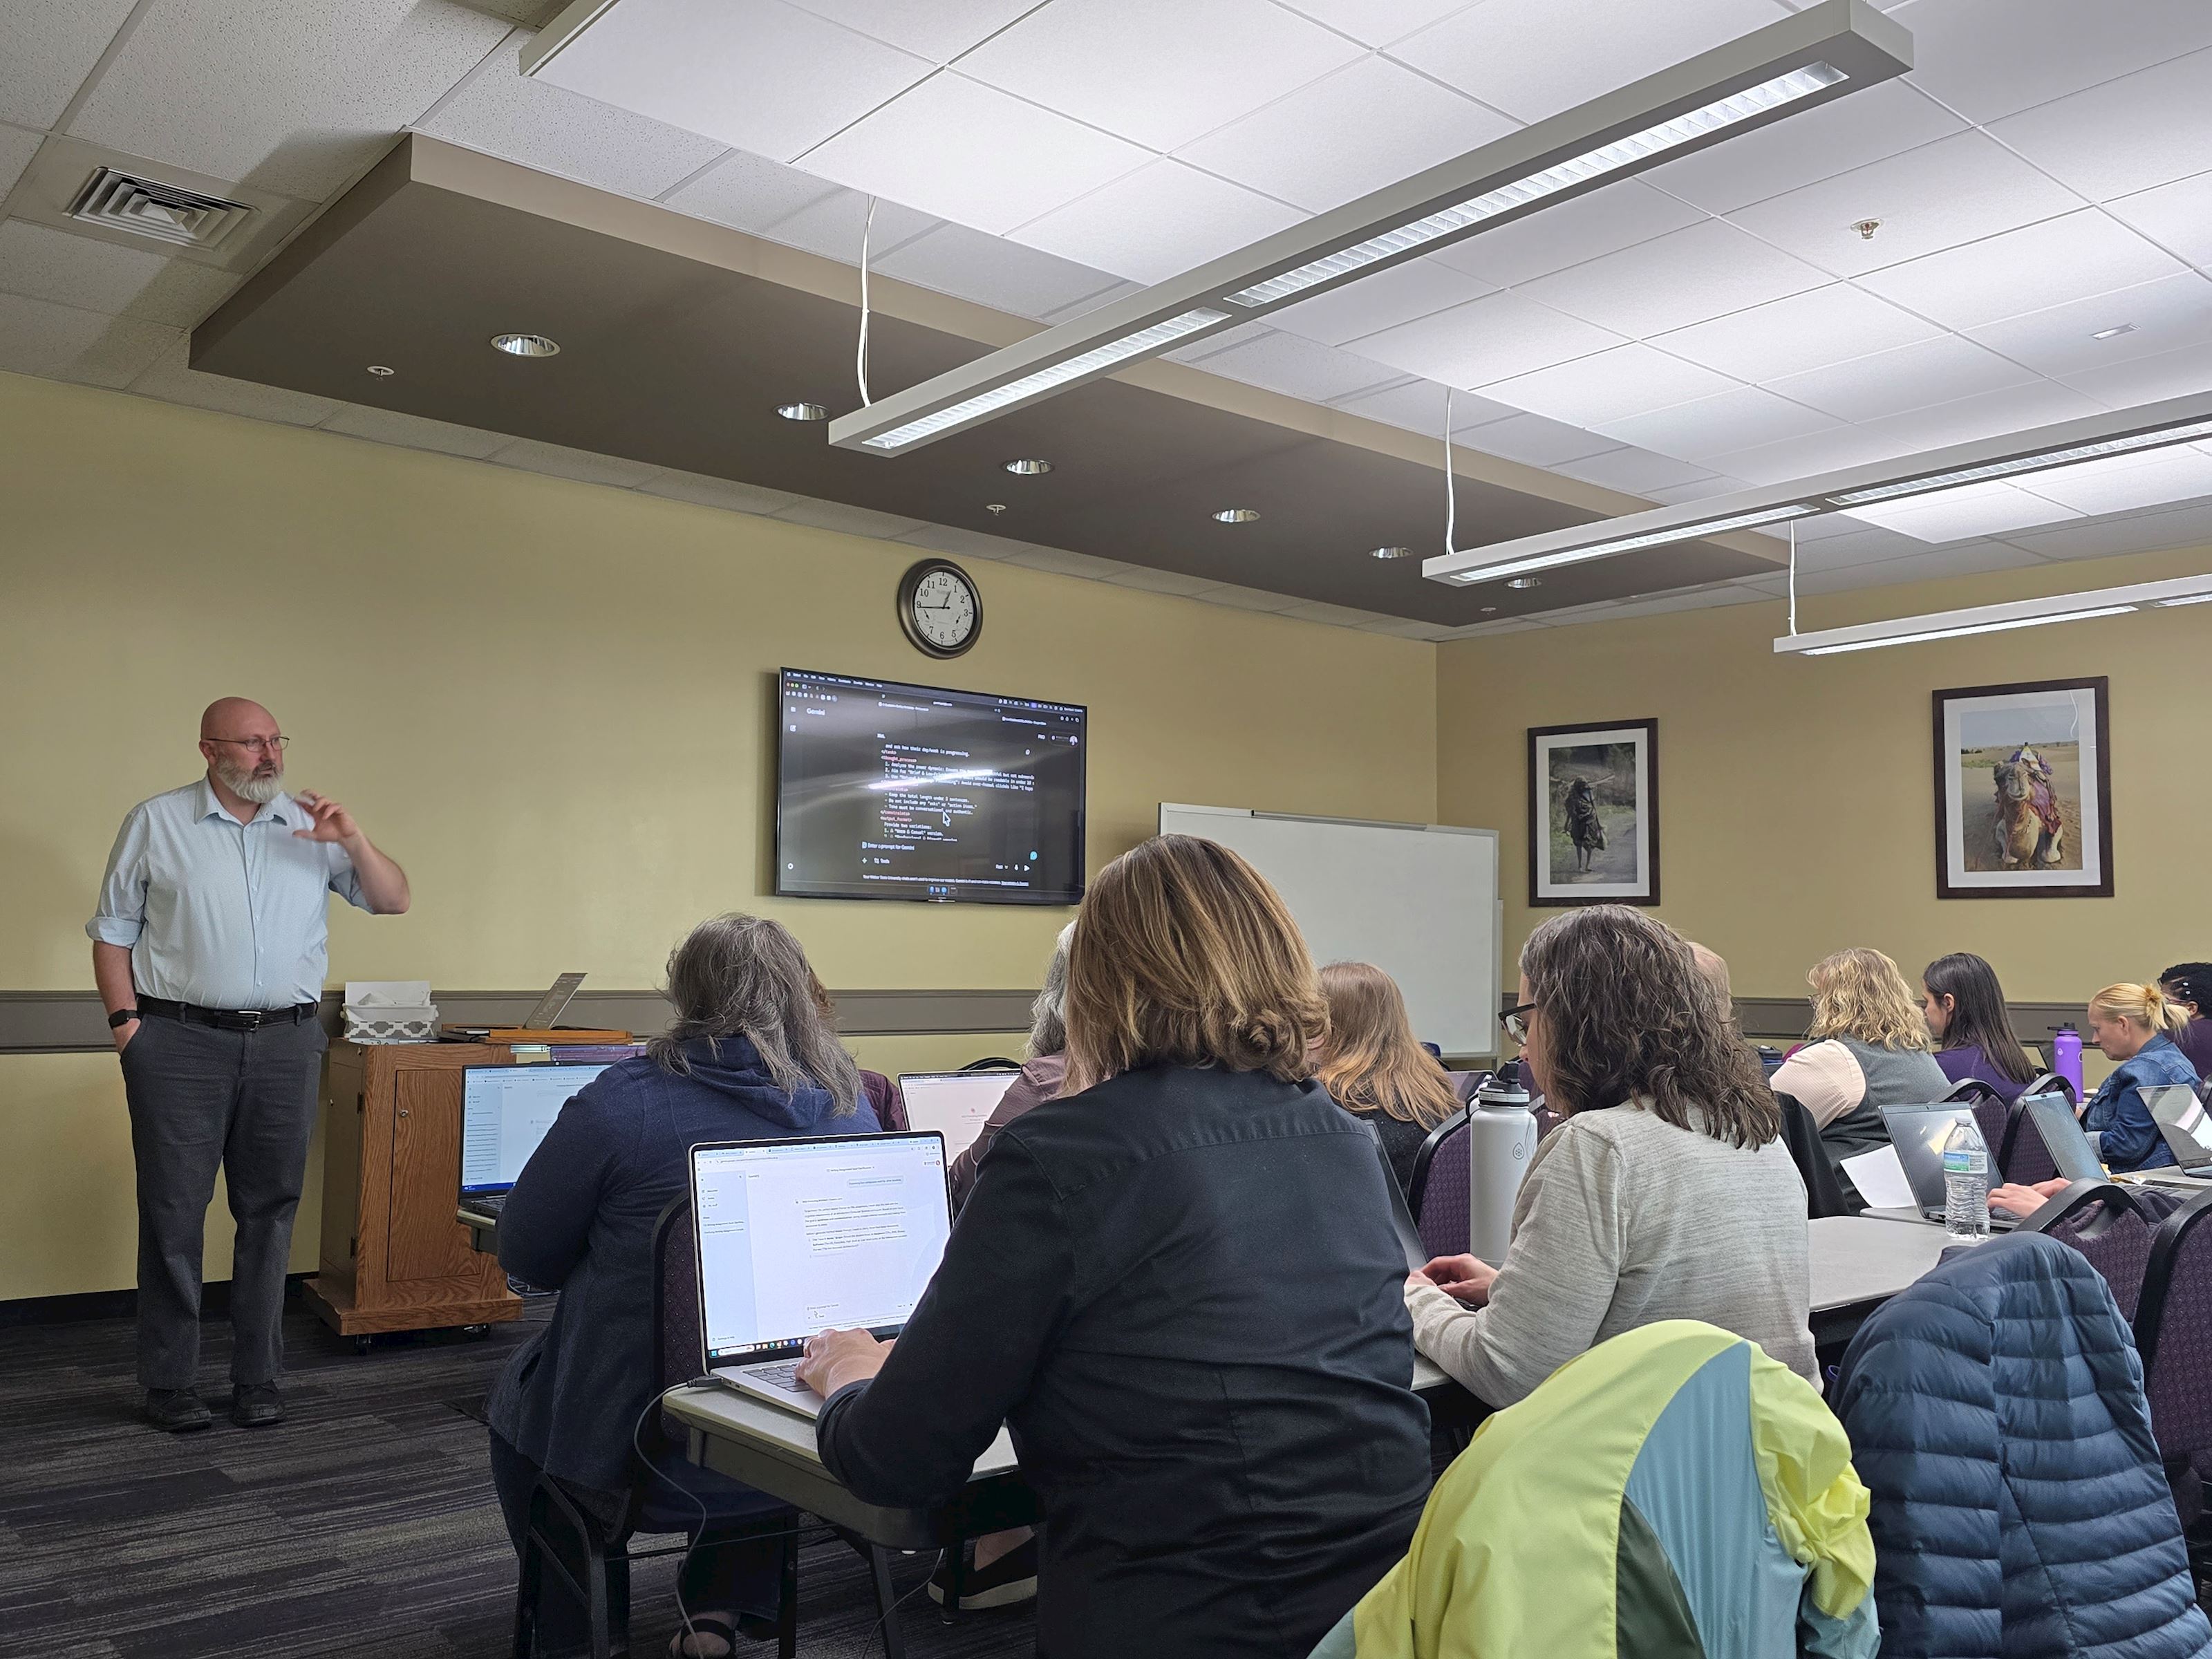
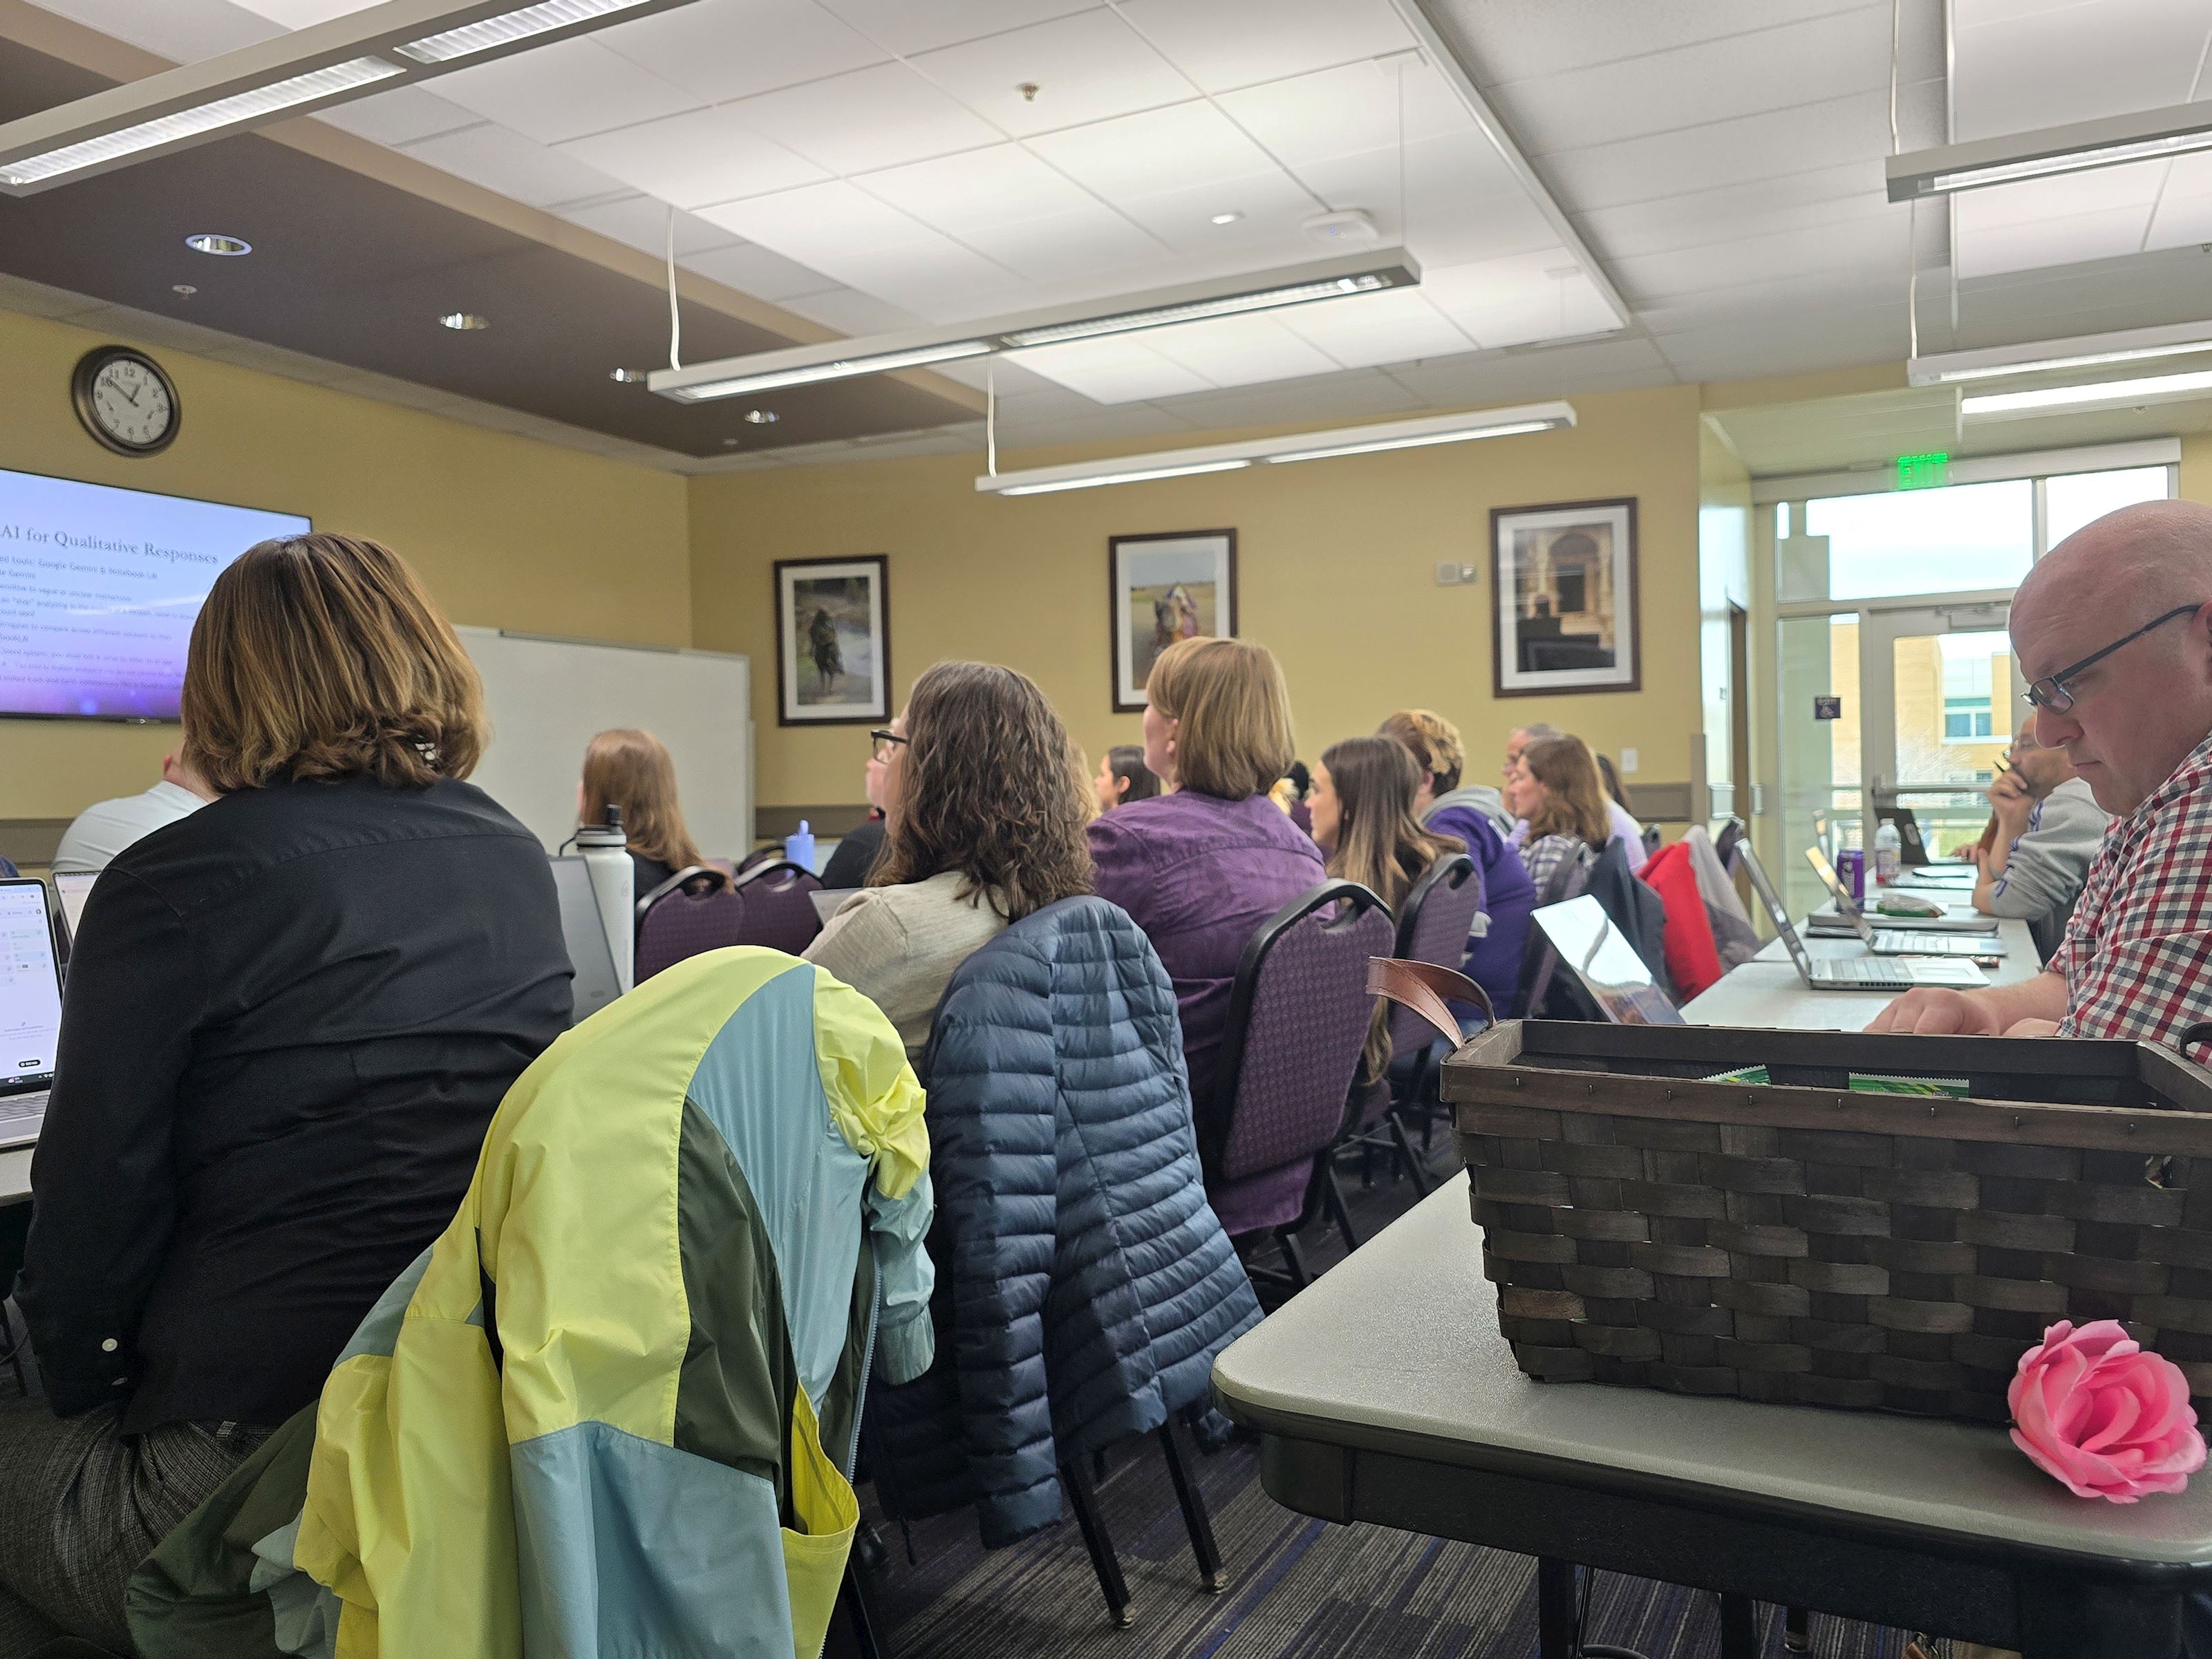
AI in Your Data Story: Practical Tools and Responsible UseExplore practical AI tools used at WSU, learn ethical and security considerations, and see real examples of AI supporting teaching, advising, and administrative work. Session Assets: Presentation Deck | Google Notebook LM Resources |
| Tuesday, Feb 10, 2026
10:00 - 11:30 am |
Workshop |
Turning Data Into Story: Quick-Start Excel for Faculty and StaffGain essential Excel skills for organizing data, performing calculations, and creating simple charts, with tips for handling everyday datasets efficiently. Session Assets: Presentation Deck |
| Wednesday, Feb 11, 2026
10:00 - 11:30 am |
Workshop & Discussion |
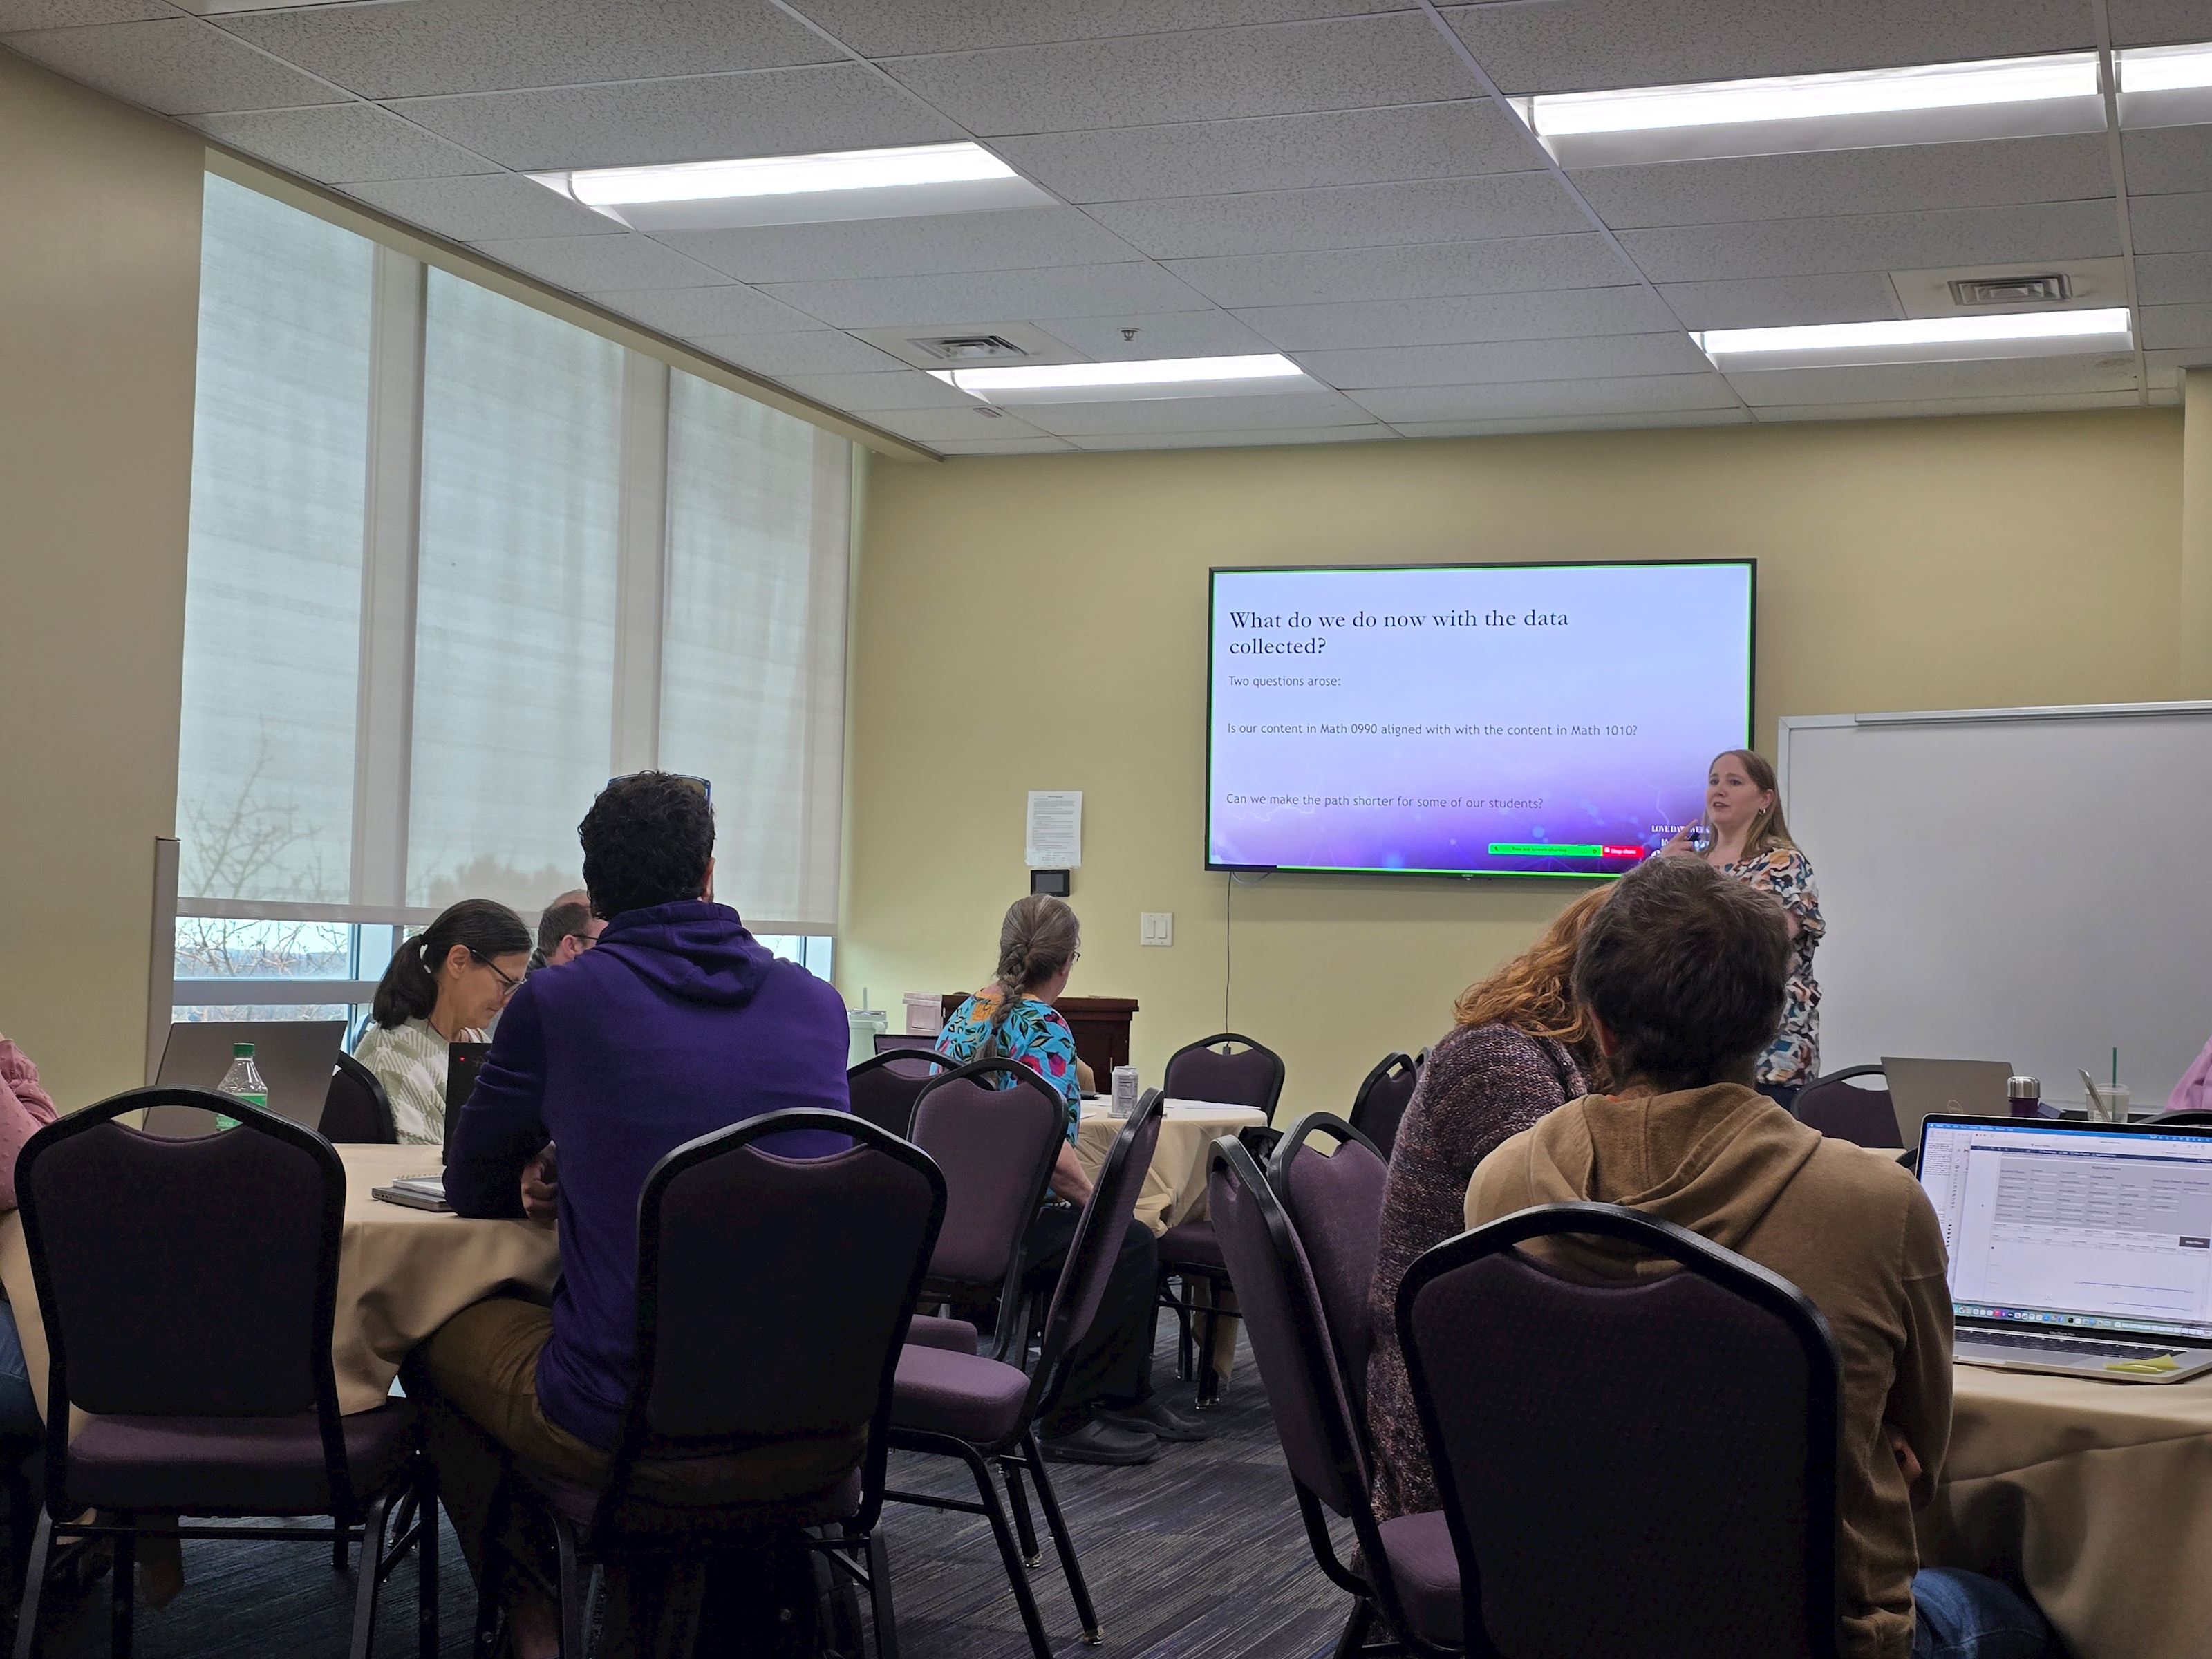
From Dashboard to Decisions: Turning First-Year Data into ActionSee how DFWI insights from the Course Information dashboard supported math pathways, gateway course analysis, and Developmental Math improvements. Session Assets: Presentation Deck | Recording |
| Wednesday, Feb 11, 2026
2:00 - 3:00 pm |
Virtual Presentation |
Love at First Insight: Using Career and Workforce Data to Inform DecisionsThis session examines how Lightcast data supports workforce and labor market insights, including emerging skills, AI, and industry trends. Practical examples from Analyst, Career Coach, and Alumni Pathways demonstrate how these insights drive stronger decisions and campus outcomes. Session Assets: Presentation Deck | Recording | AI Skills Report | The Rising Storm Demographic Report |
| Thursday, Feb 12, 2026
10:00 - 11:30 am |
Workshop |
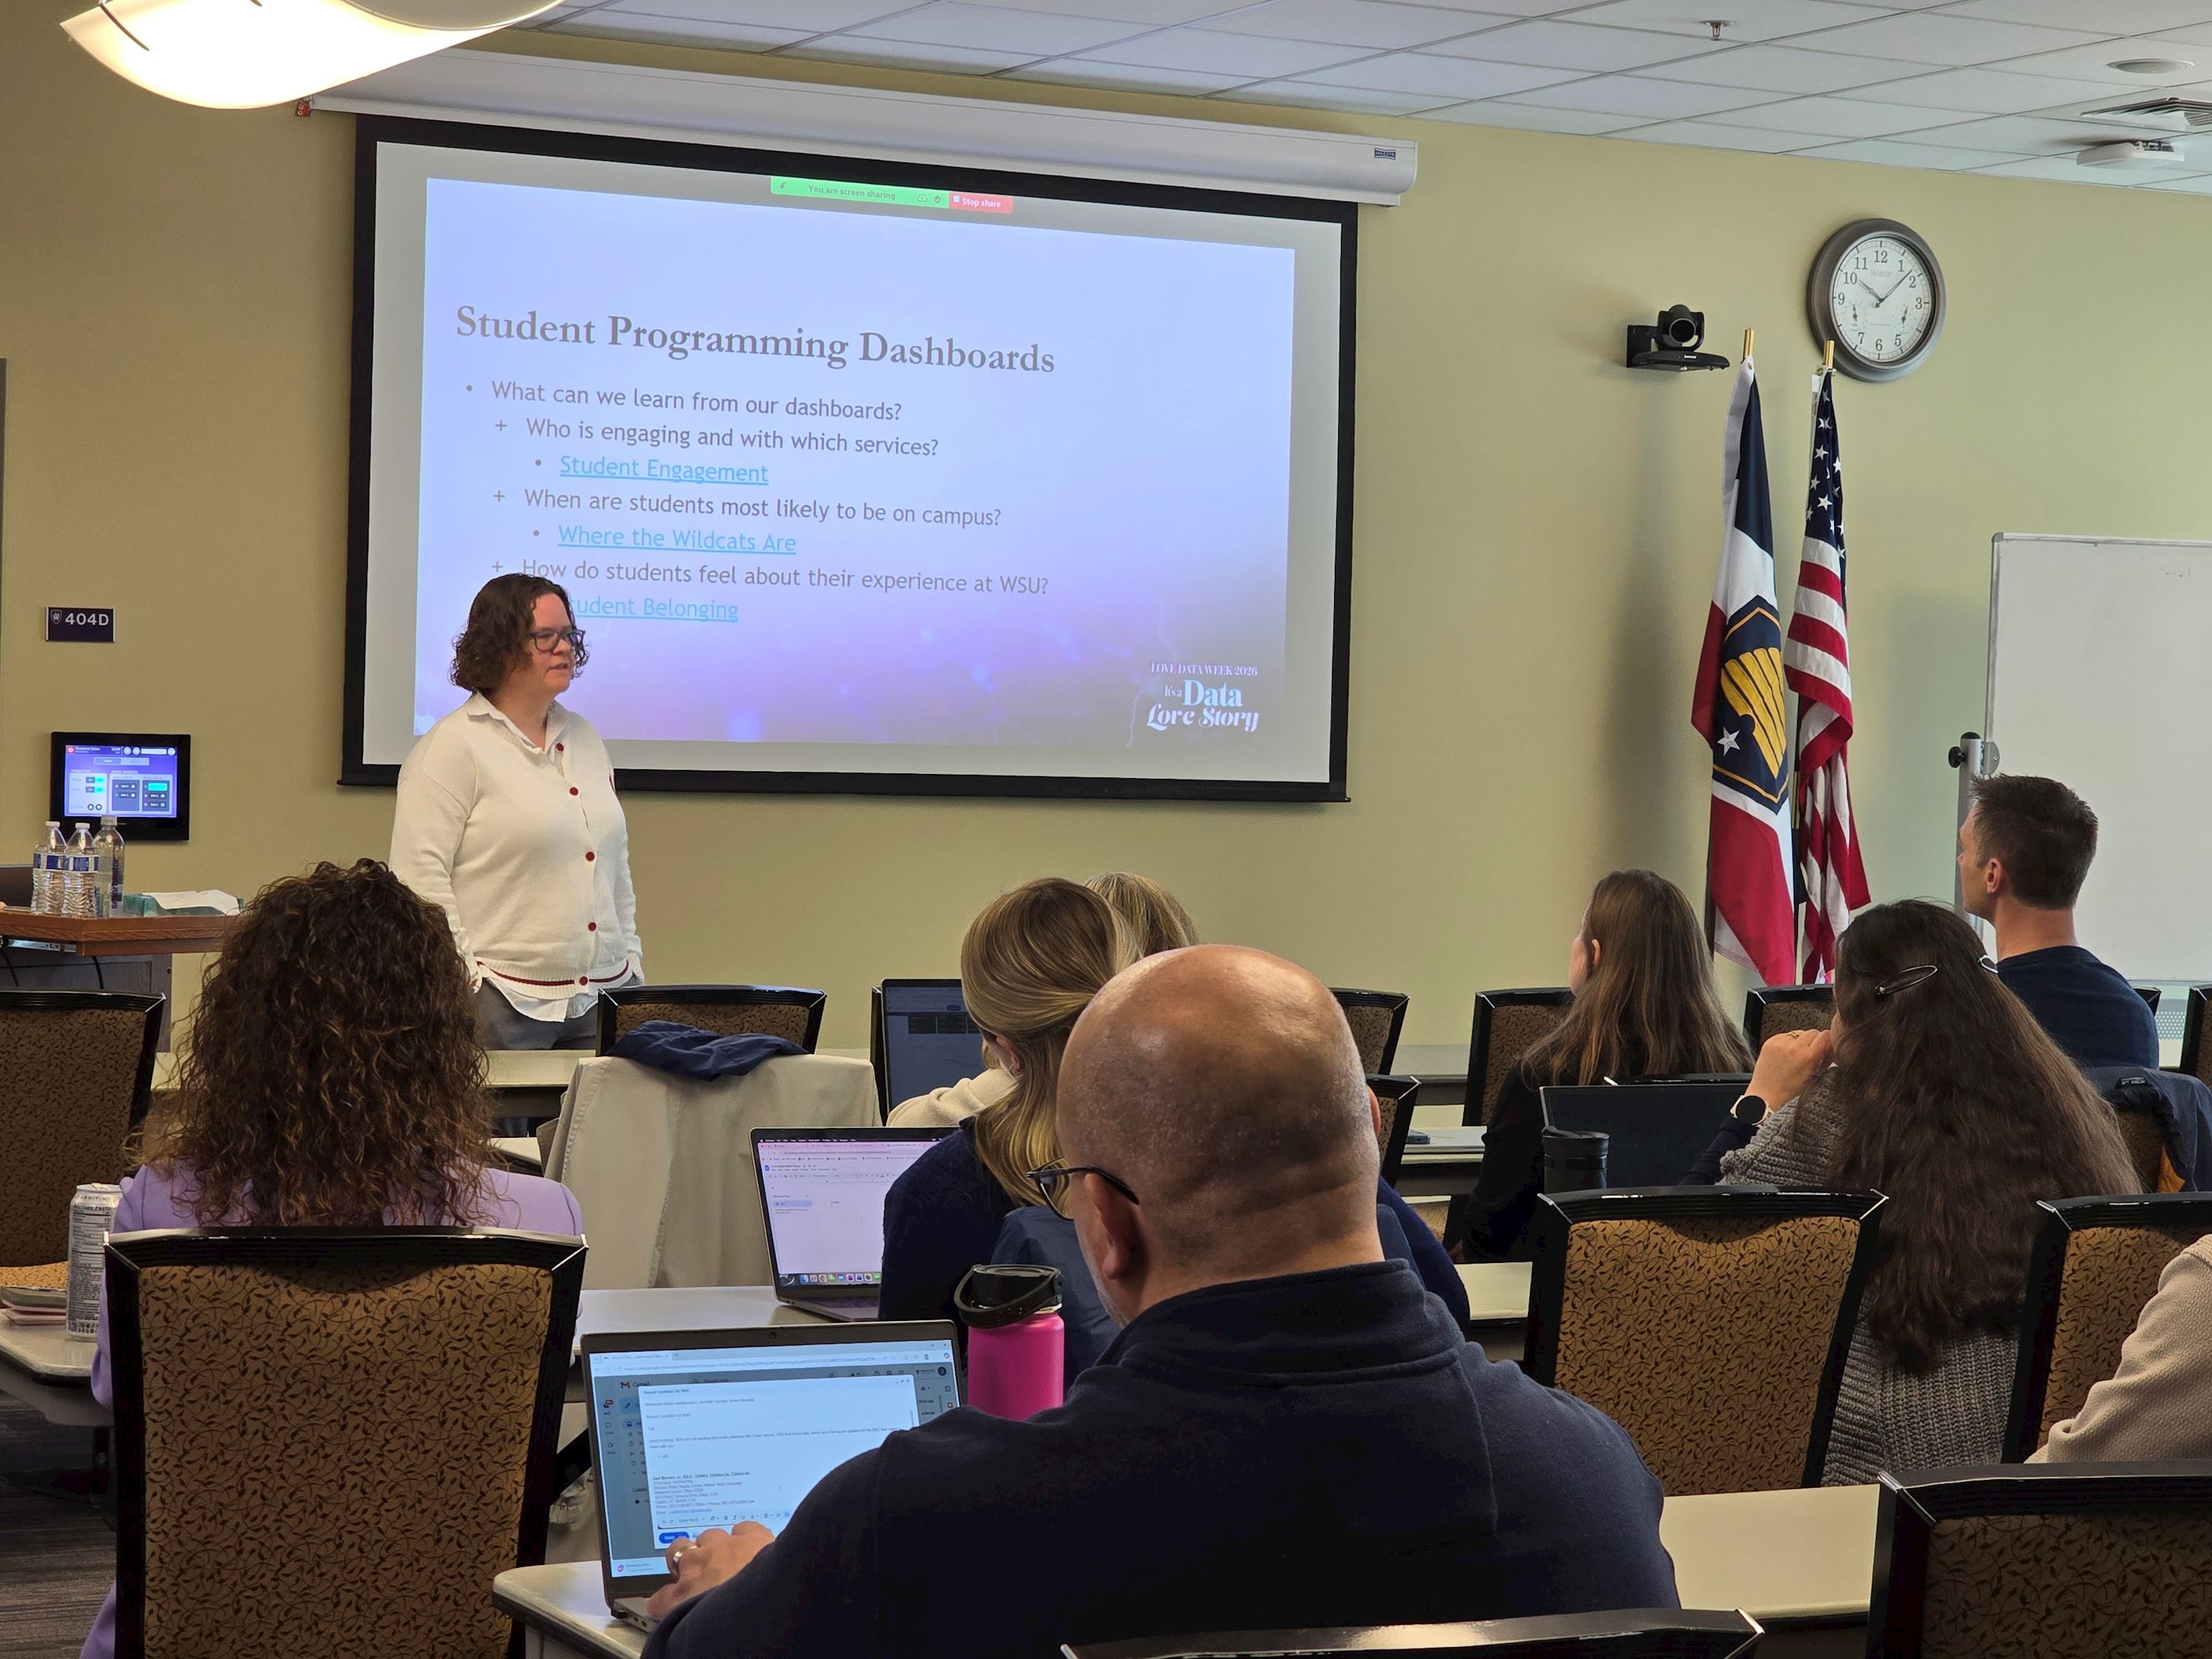
Crafting Your Data Story: Student Programming Dashboards and Best PracticesHands-on lab using campus dashboards to analyze student program engagement, followed by practical guidance for improving data collection, reporting, and process alignment. Session Assets: Presentation Deck | Recording |
| Thursday, Feb 12, 2026
2:00 - 4:00 pm |
Social & Celebration |
Happily Ever After With Data: Data Viz Awards and Closing SocialA drop-in closing social celebrating campus data stories—featuring refreshments, cozy crafting, data viz awards, and a chance to connect with fellow data colleagues and leadership. Come meet IT’s new CIO and AVP, Rene Eborn! Session Assets: Presentation Deck |
2026 Love Data Week Snapshots
📋 Session Details:
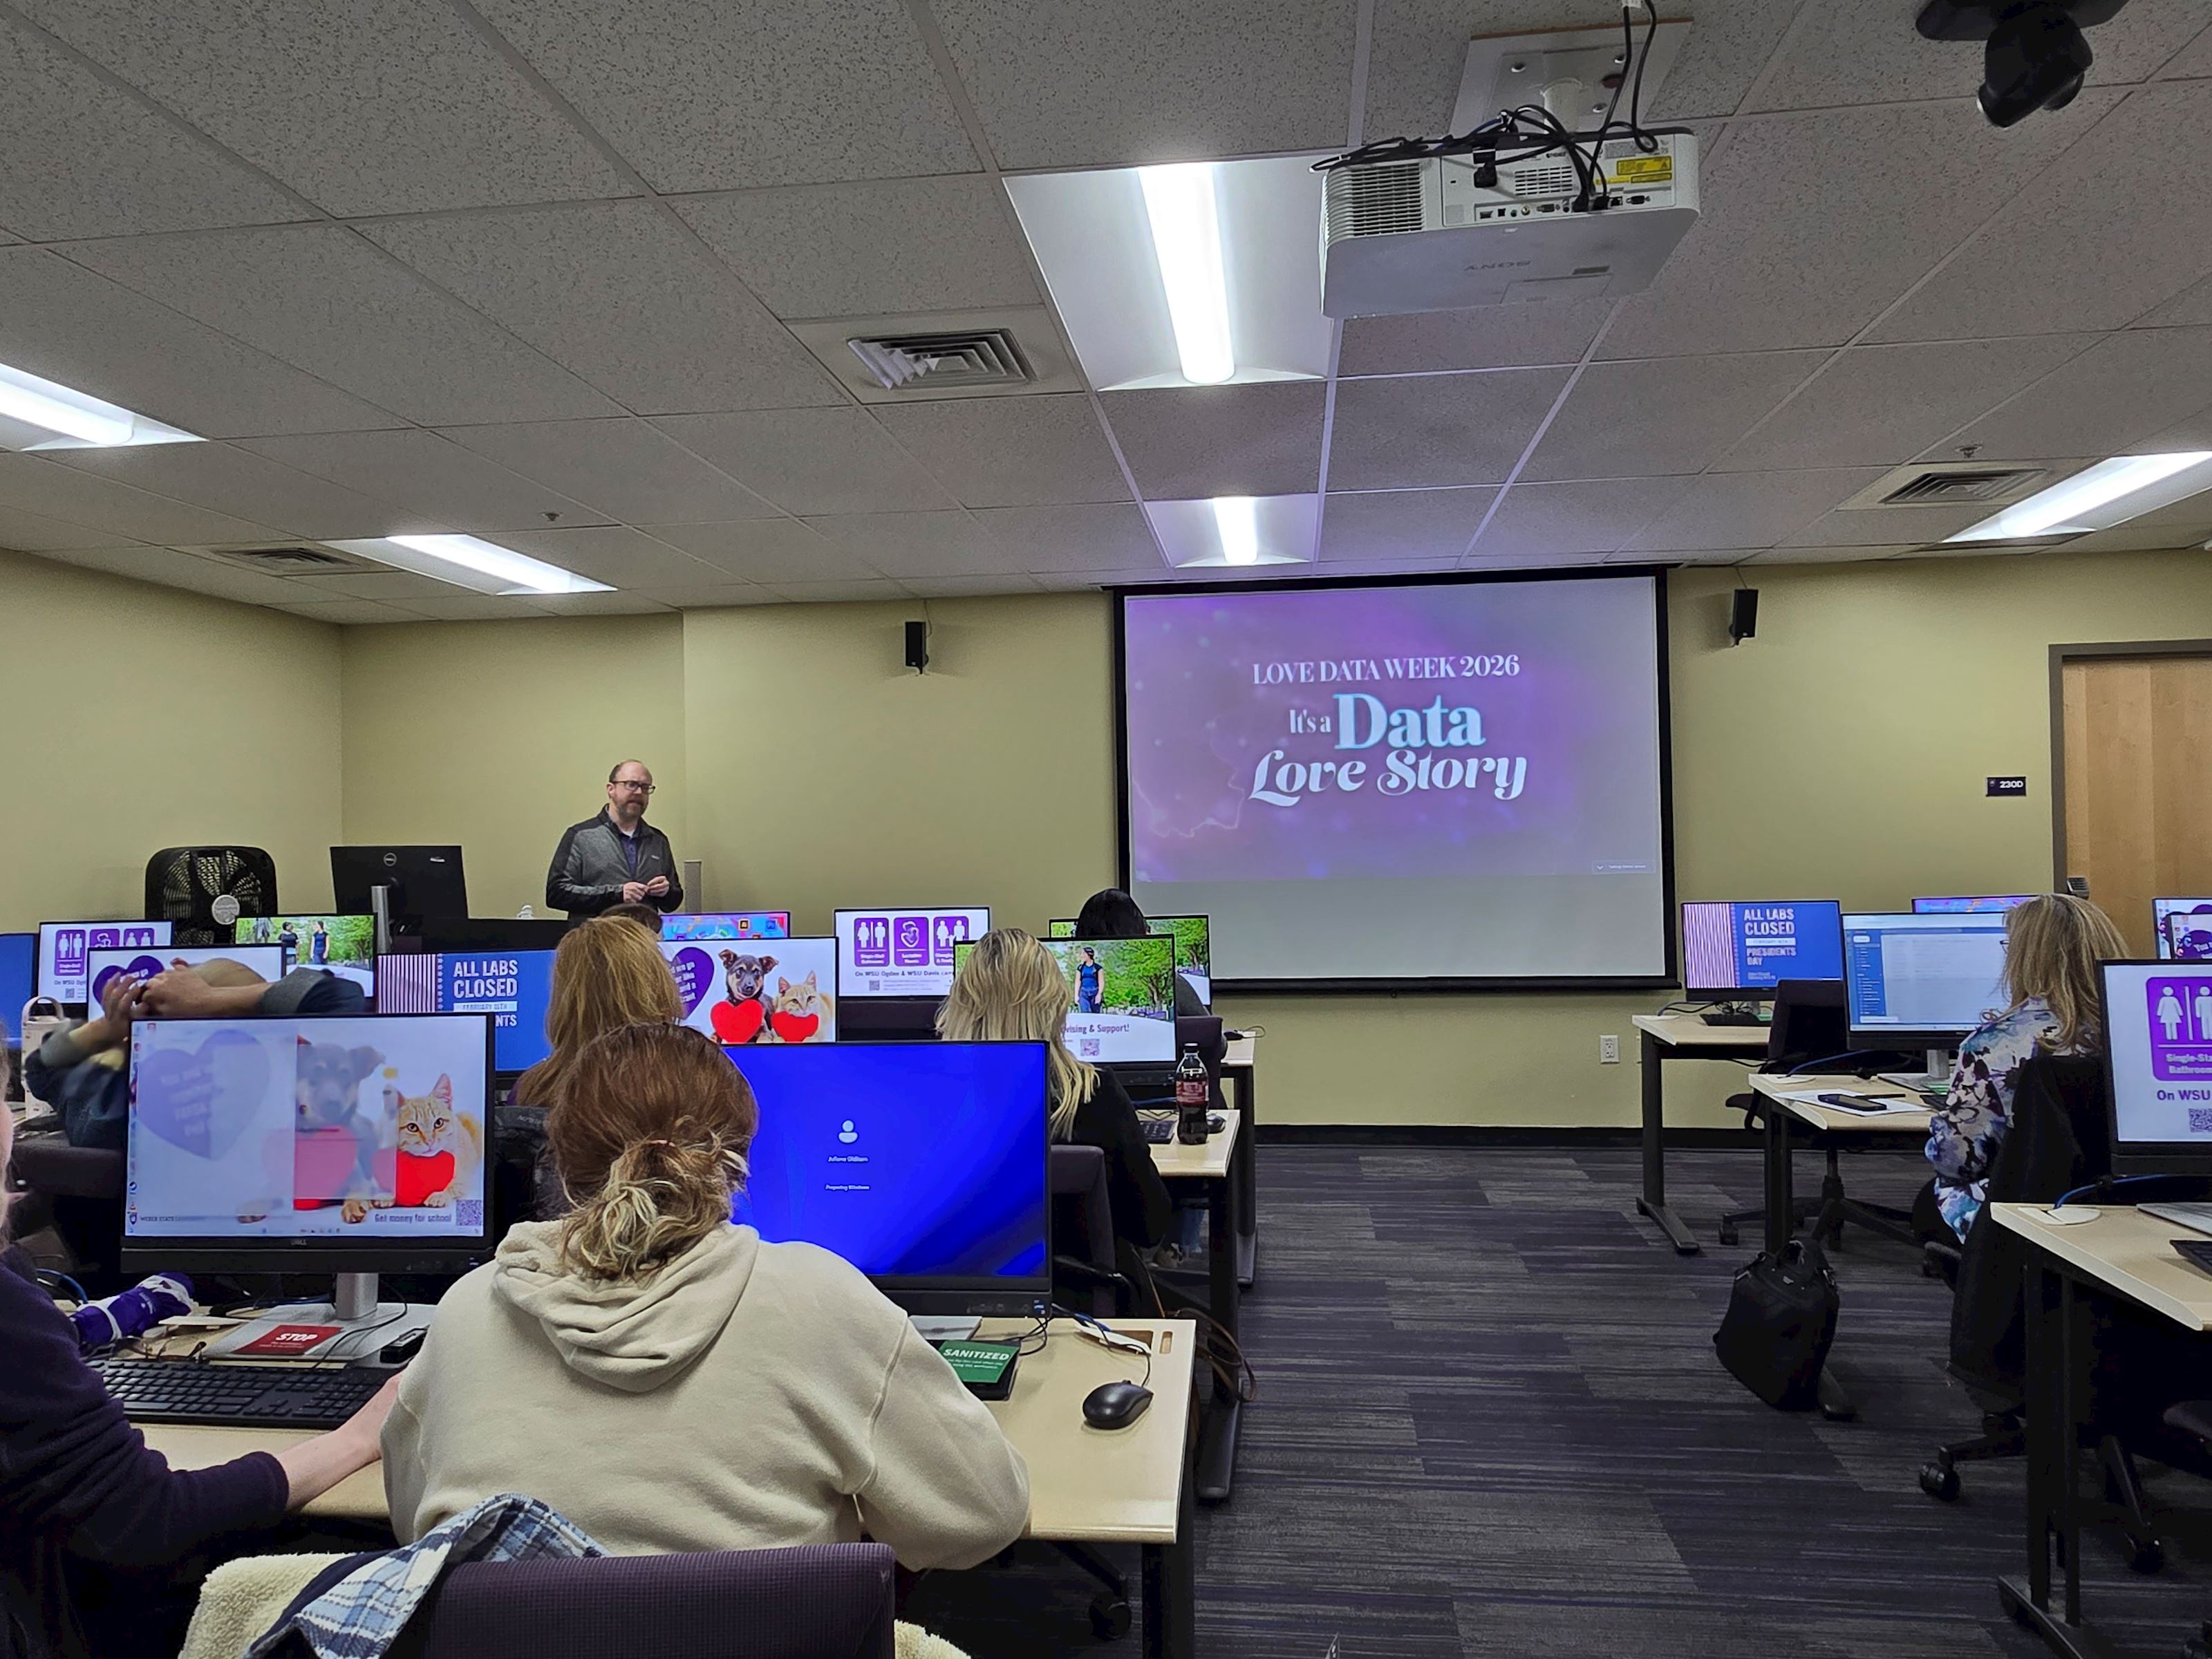
Your First Chapter in Data: Navigating and Using WSU Resources
Format: Presentation & Workshop
Date & Time: Feb 9 | 10:00 - 11:30 am
This session introduces employees to WSU’s data ecosystem while building foundational data literacy skills focused on both accessing data and asking the right questions of it. Participants learn where institutional data lives, how to request and interpret it responsibly, and how to frame role-appropriate data questions that support effective decision-making.
Presenters:
Daniel Jensen
Data Training & Communication Manager
Student Success Analytics
AI in Your Data Story: Practical Tools and Responsible Use
Session Type: Workshop
Date & Time: Feb 9 | 12:30 - 2:00 pm
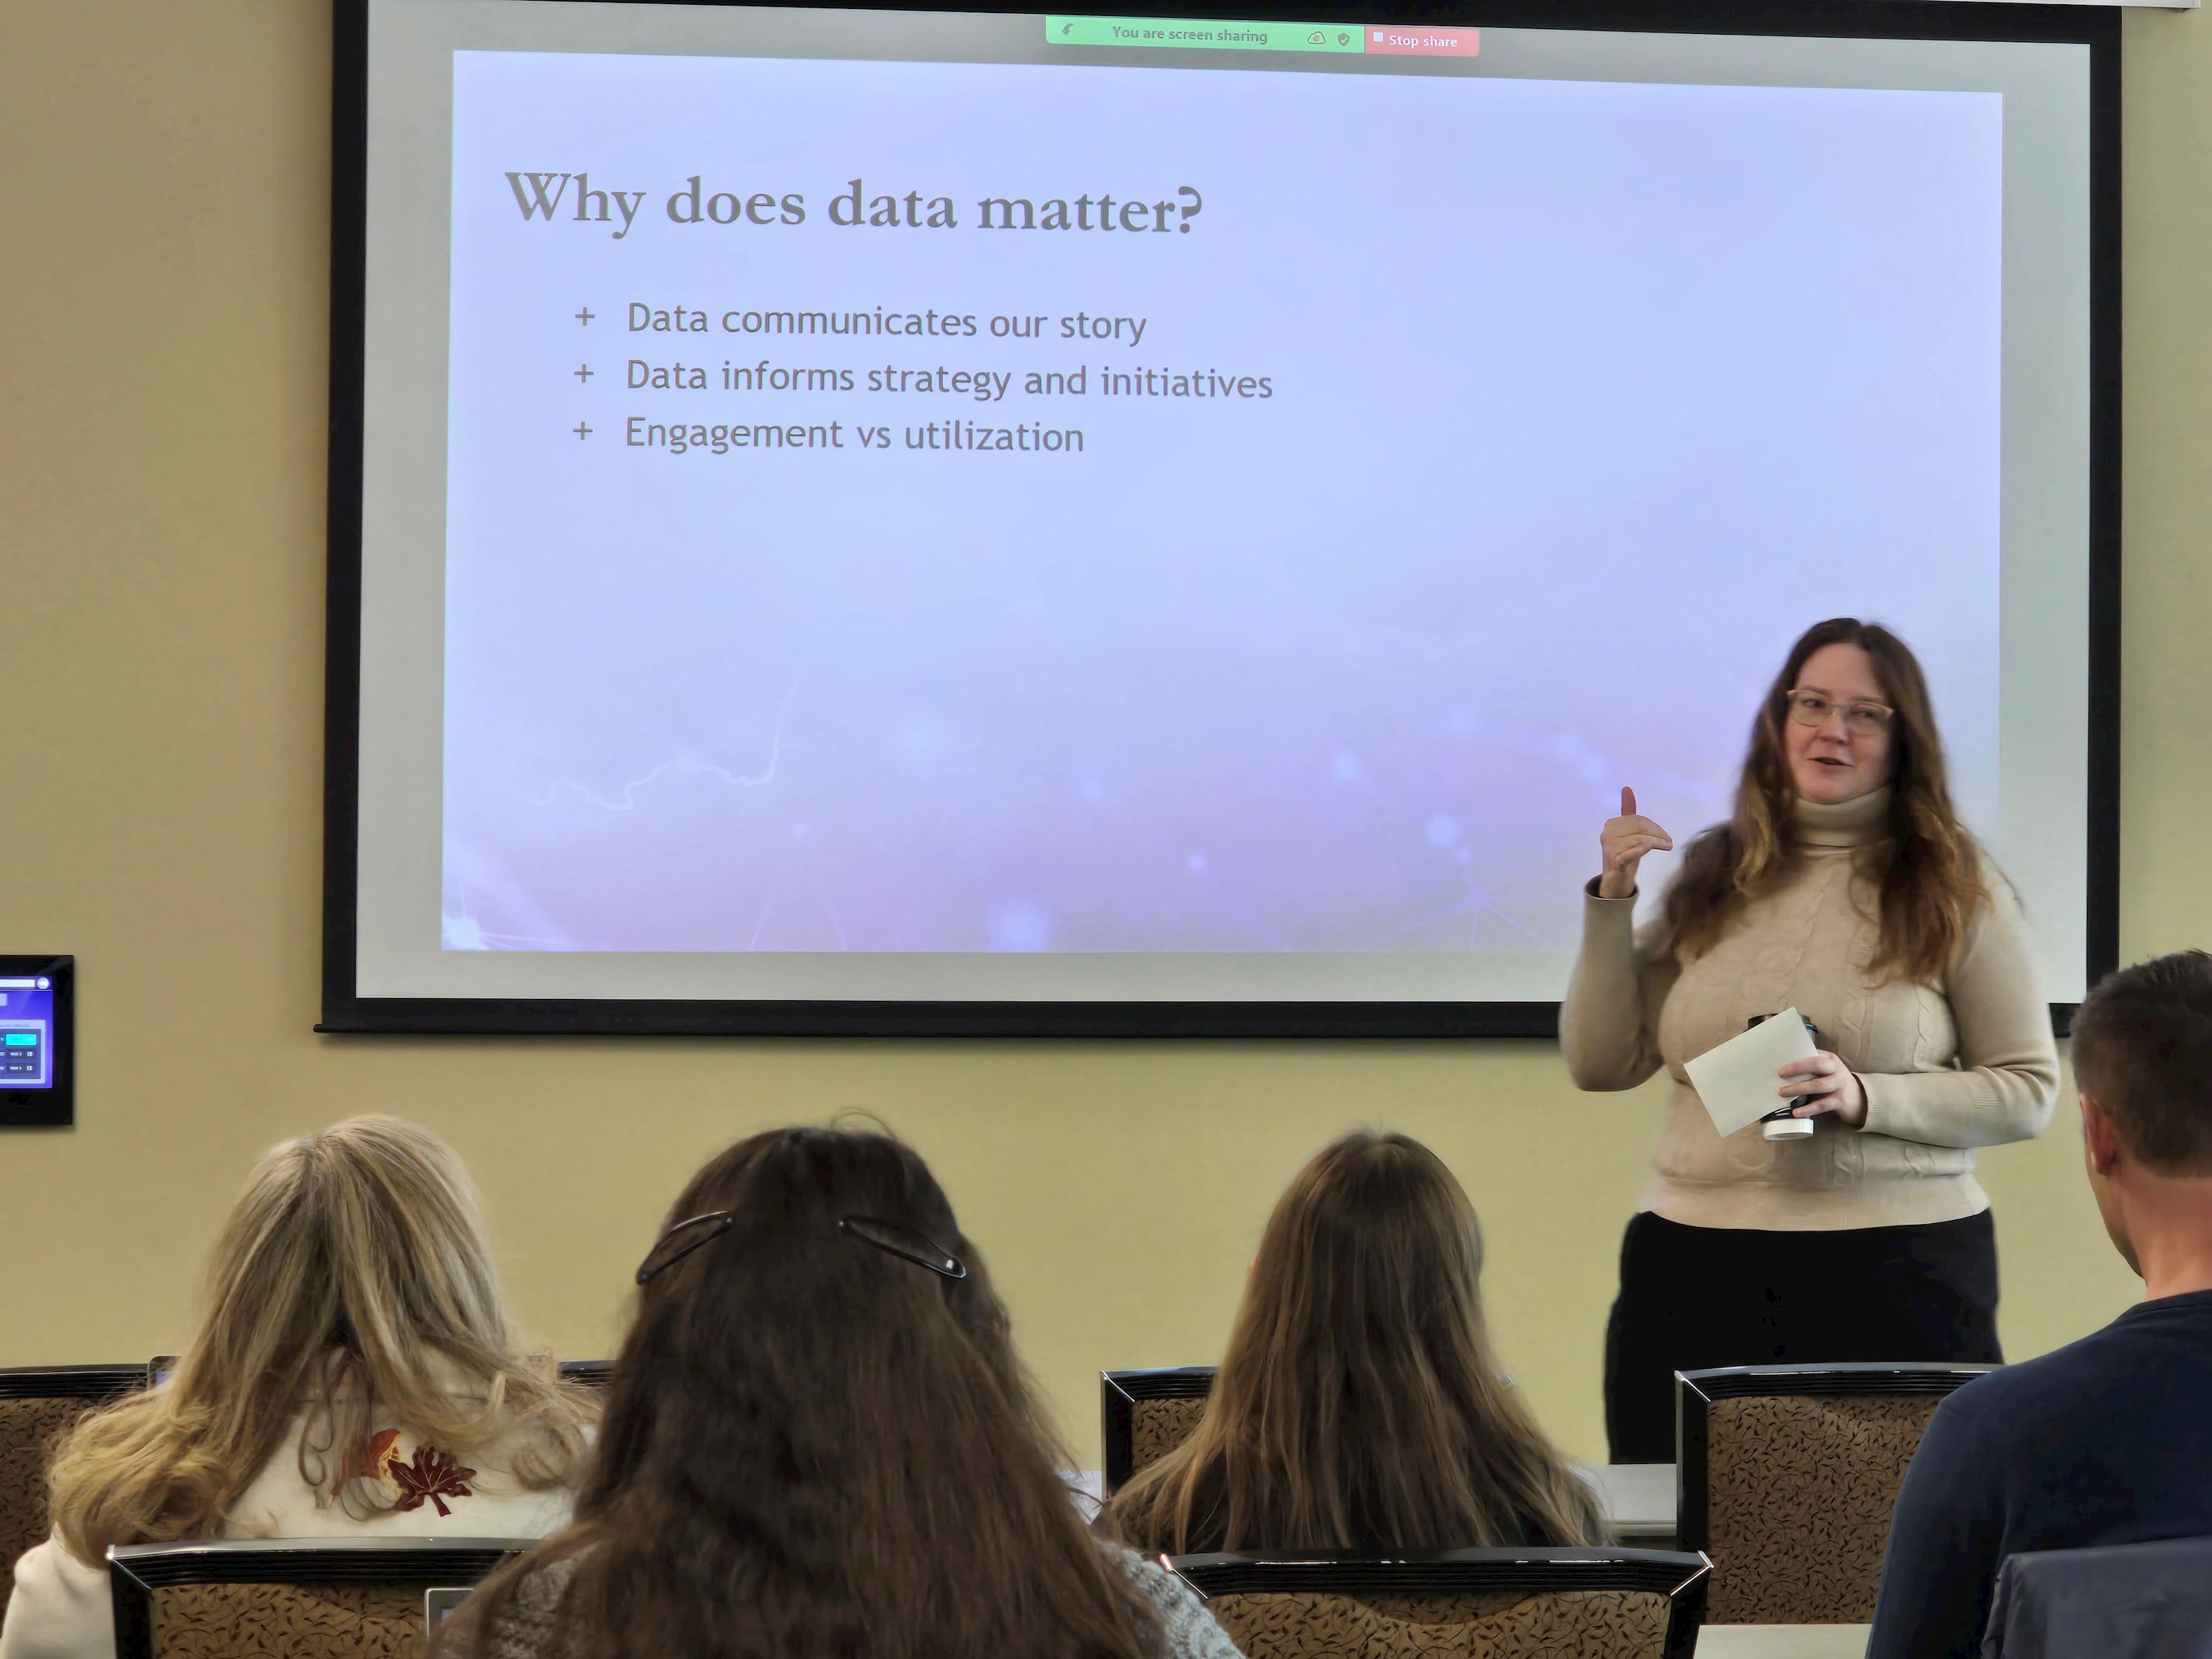
This session introduces faculty and staff to practical uses of AI tools at WSU, with an emphasis on productivity and responsible use. The session showcases real campus use cases, such as leveraging AI to summarize open-ended survey comments, identify recurring themes, and draft plain-language insights, while addressing security considerations, data sensitivity, and responsible boundaries for AI use.
Note: Bring your laptop for this hands-on workshop and presentation.
Presenters:
Heather Chapman
Senior Director of Data & Analytics
Student Success Analytics
Ty Naylor
IT Learning & Engagement Manager
IT Business Services
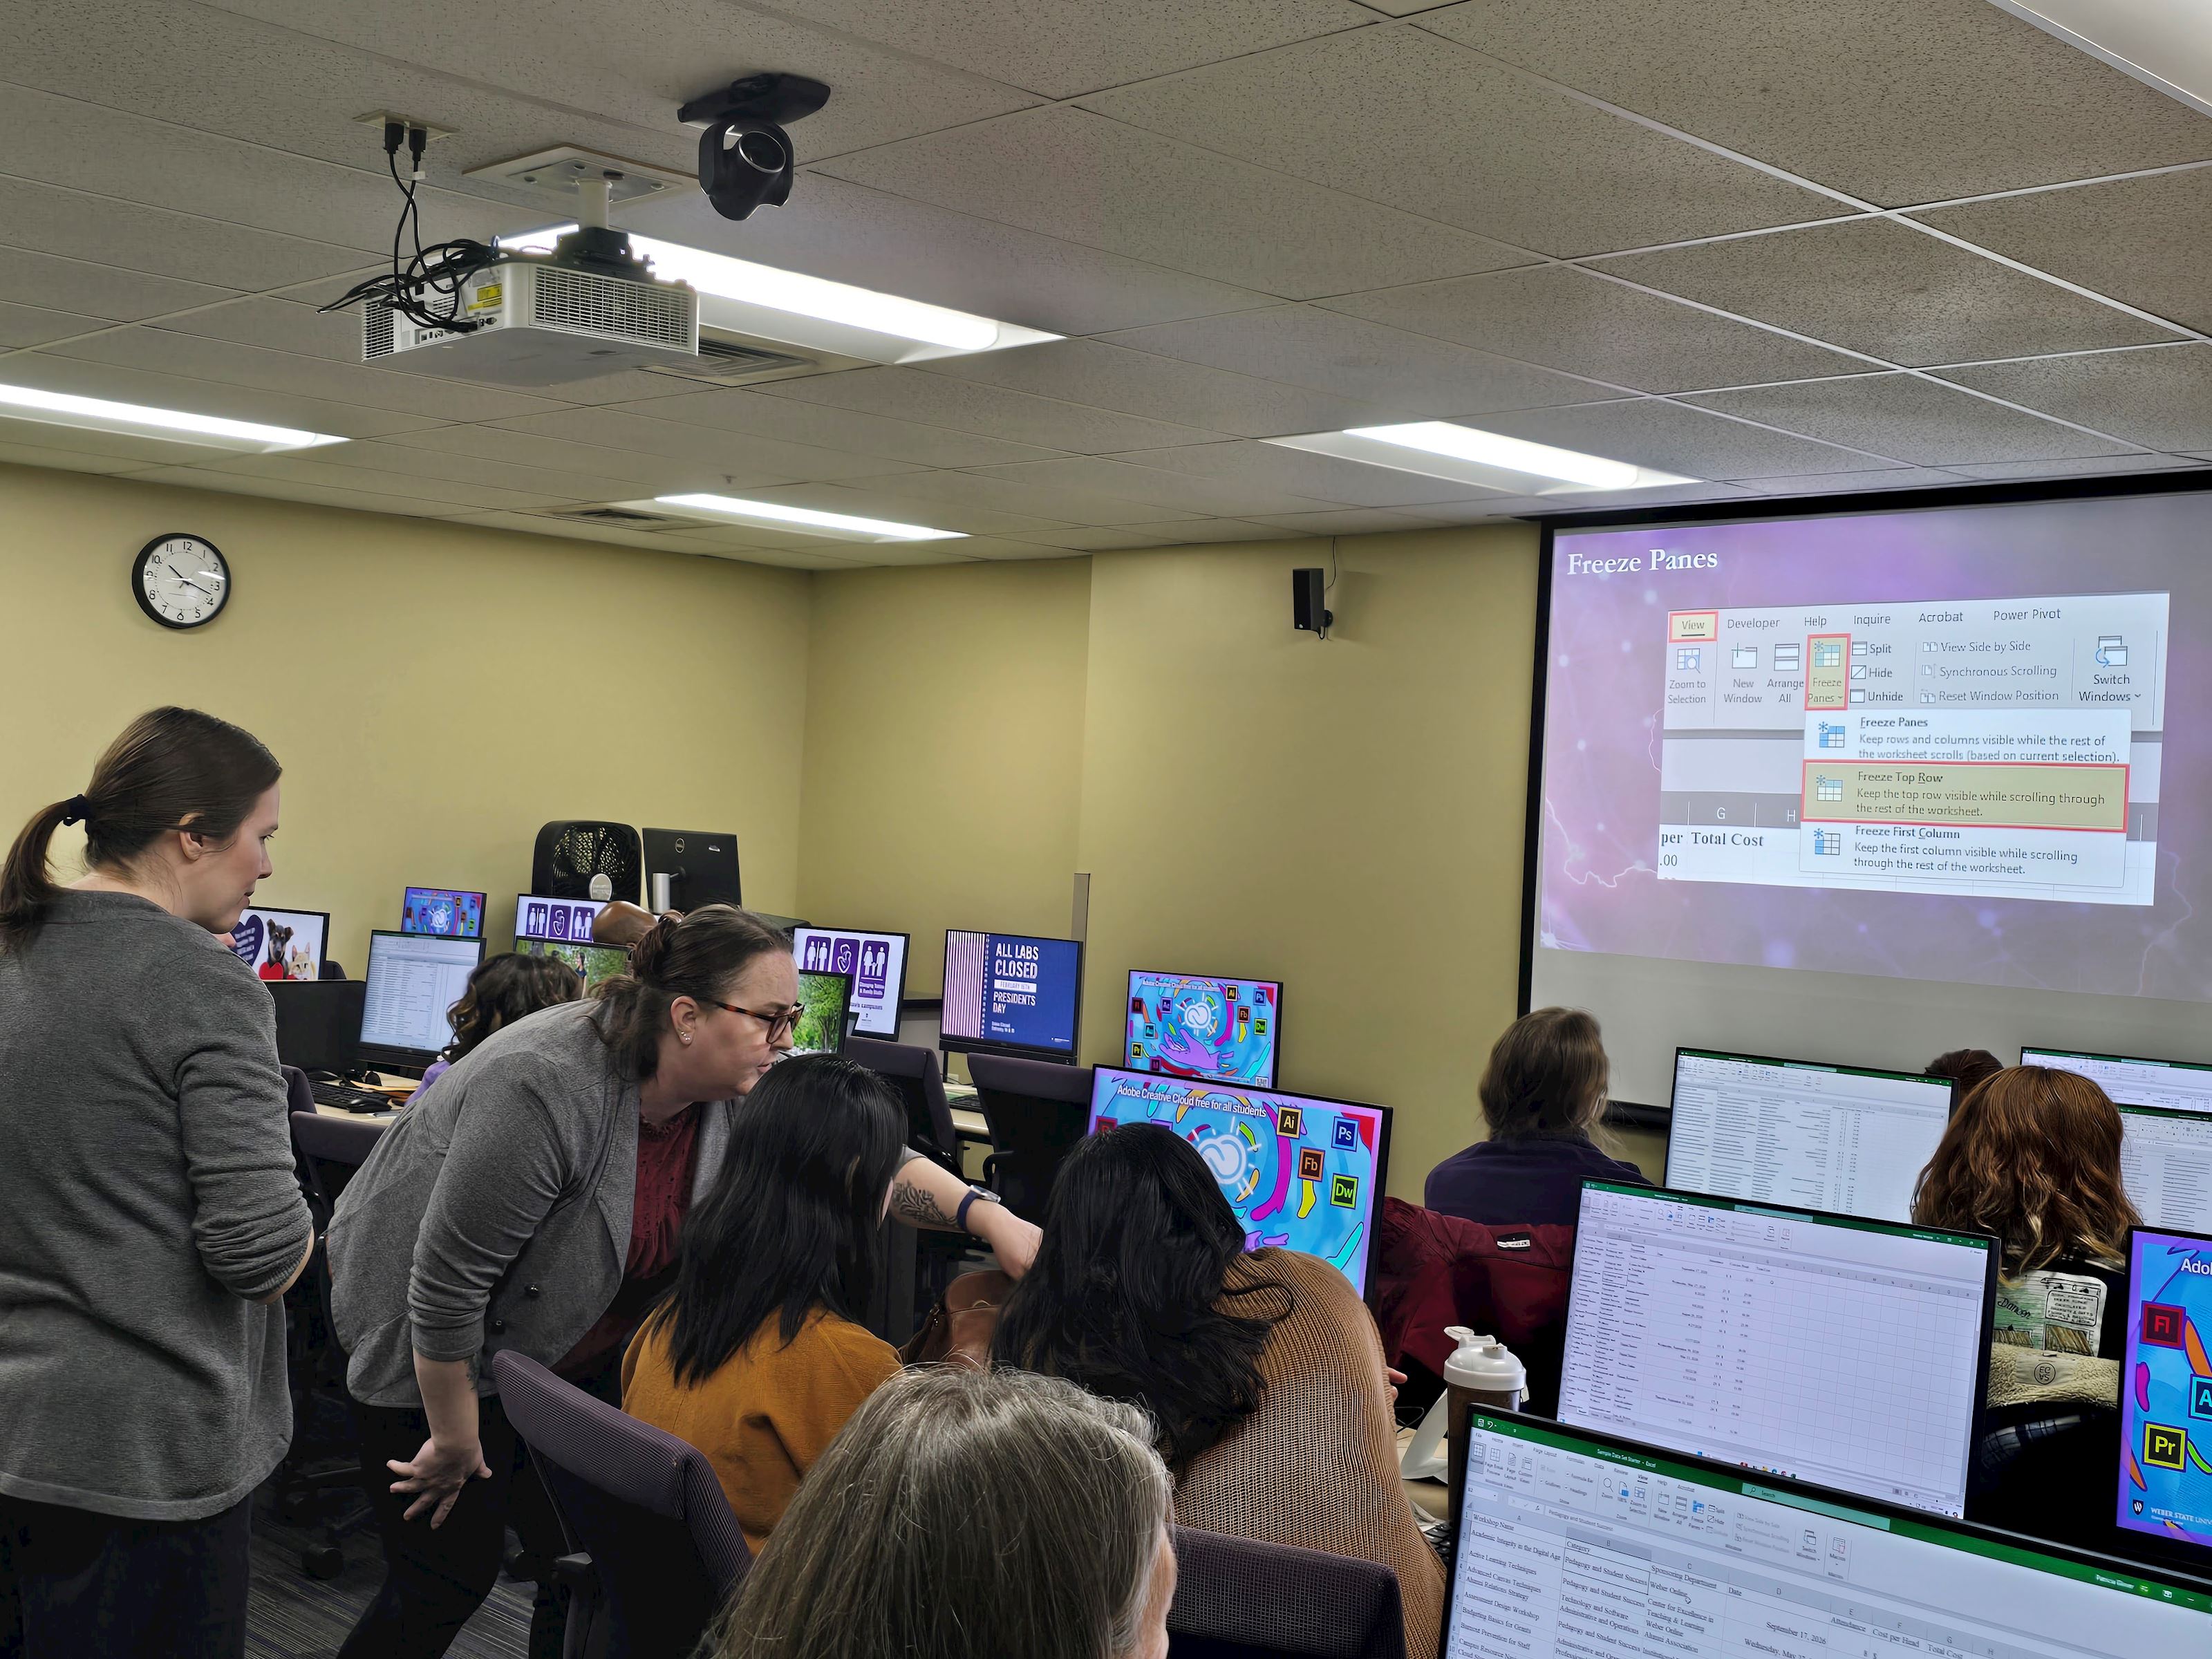
Turning Data Into Story: Quick-Start Excel for Faculty and Staff
Session Type: Workshop
Date & Time: Feb 10 | 10:00 - 11:30 am
This practical, 90-minute session is designed specifically for faculty and staff. Participants learn to move beyond basic data entry by mastering essential techniques for organizing messy datasets, automating calculations with core formulas, and creating instant visual impact through charts and conditional formatting. Whether managing student lists or departmental budgets, participants leave with the confidence and shortcut skills needed to handle everyday data tasks with speed and accuracy.
Presenters:
Shawn Berry
Analytic & Tool Support Specialist
Institutional Effectiveness
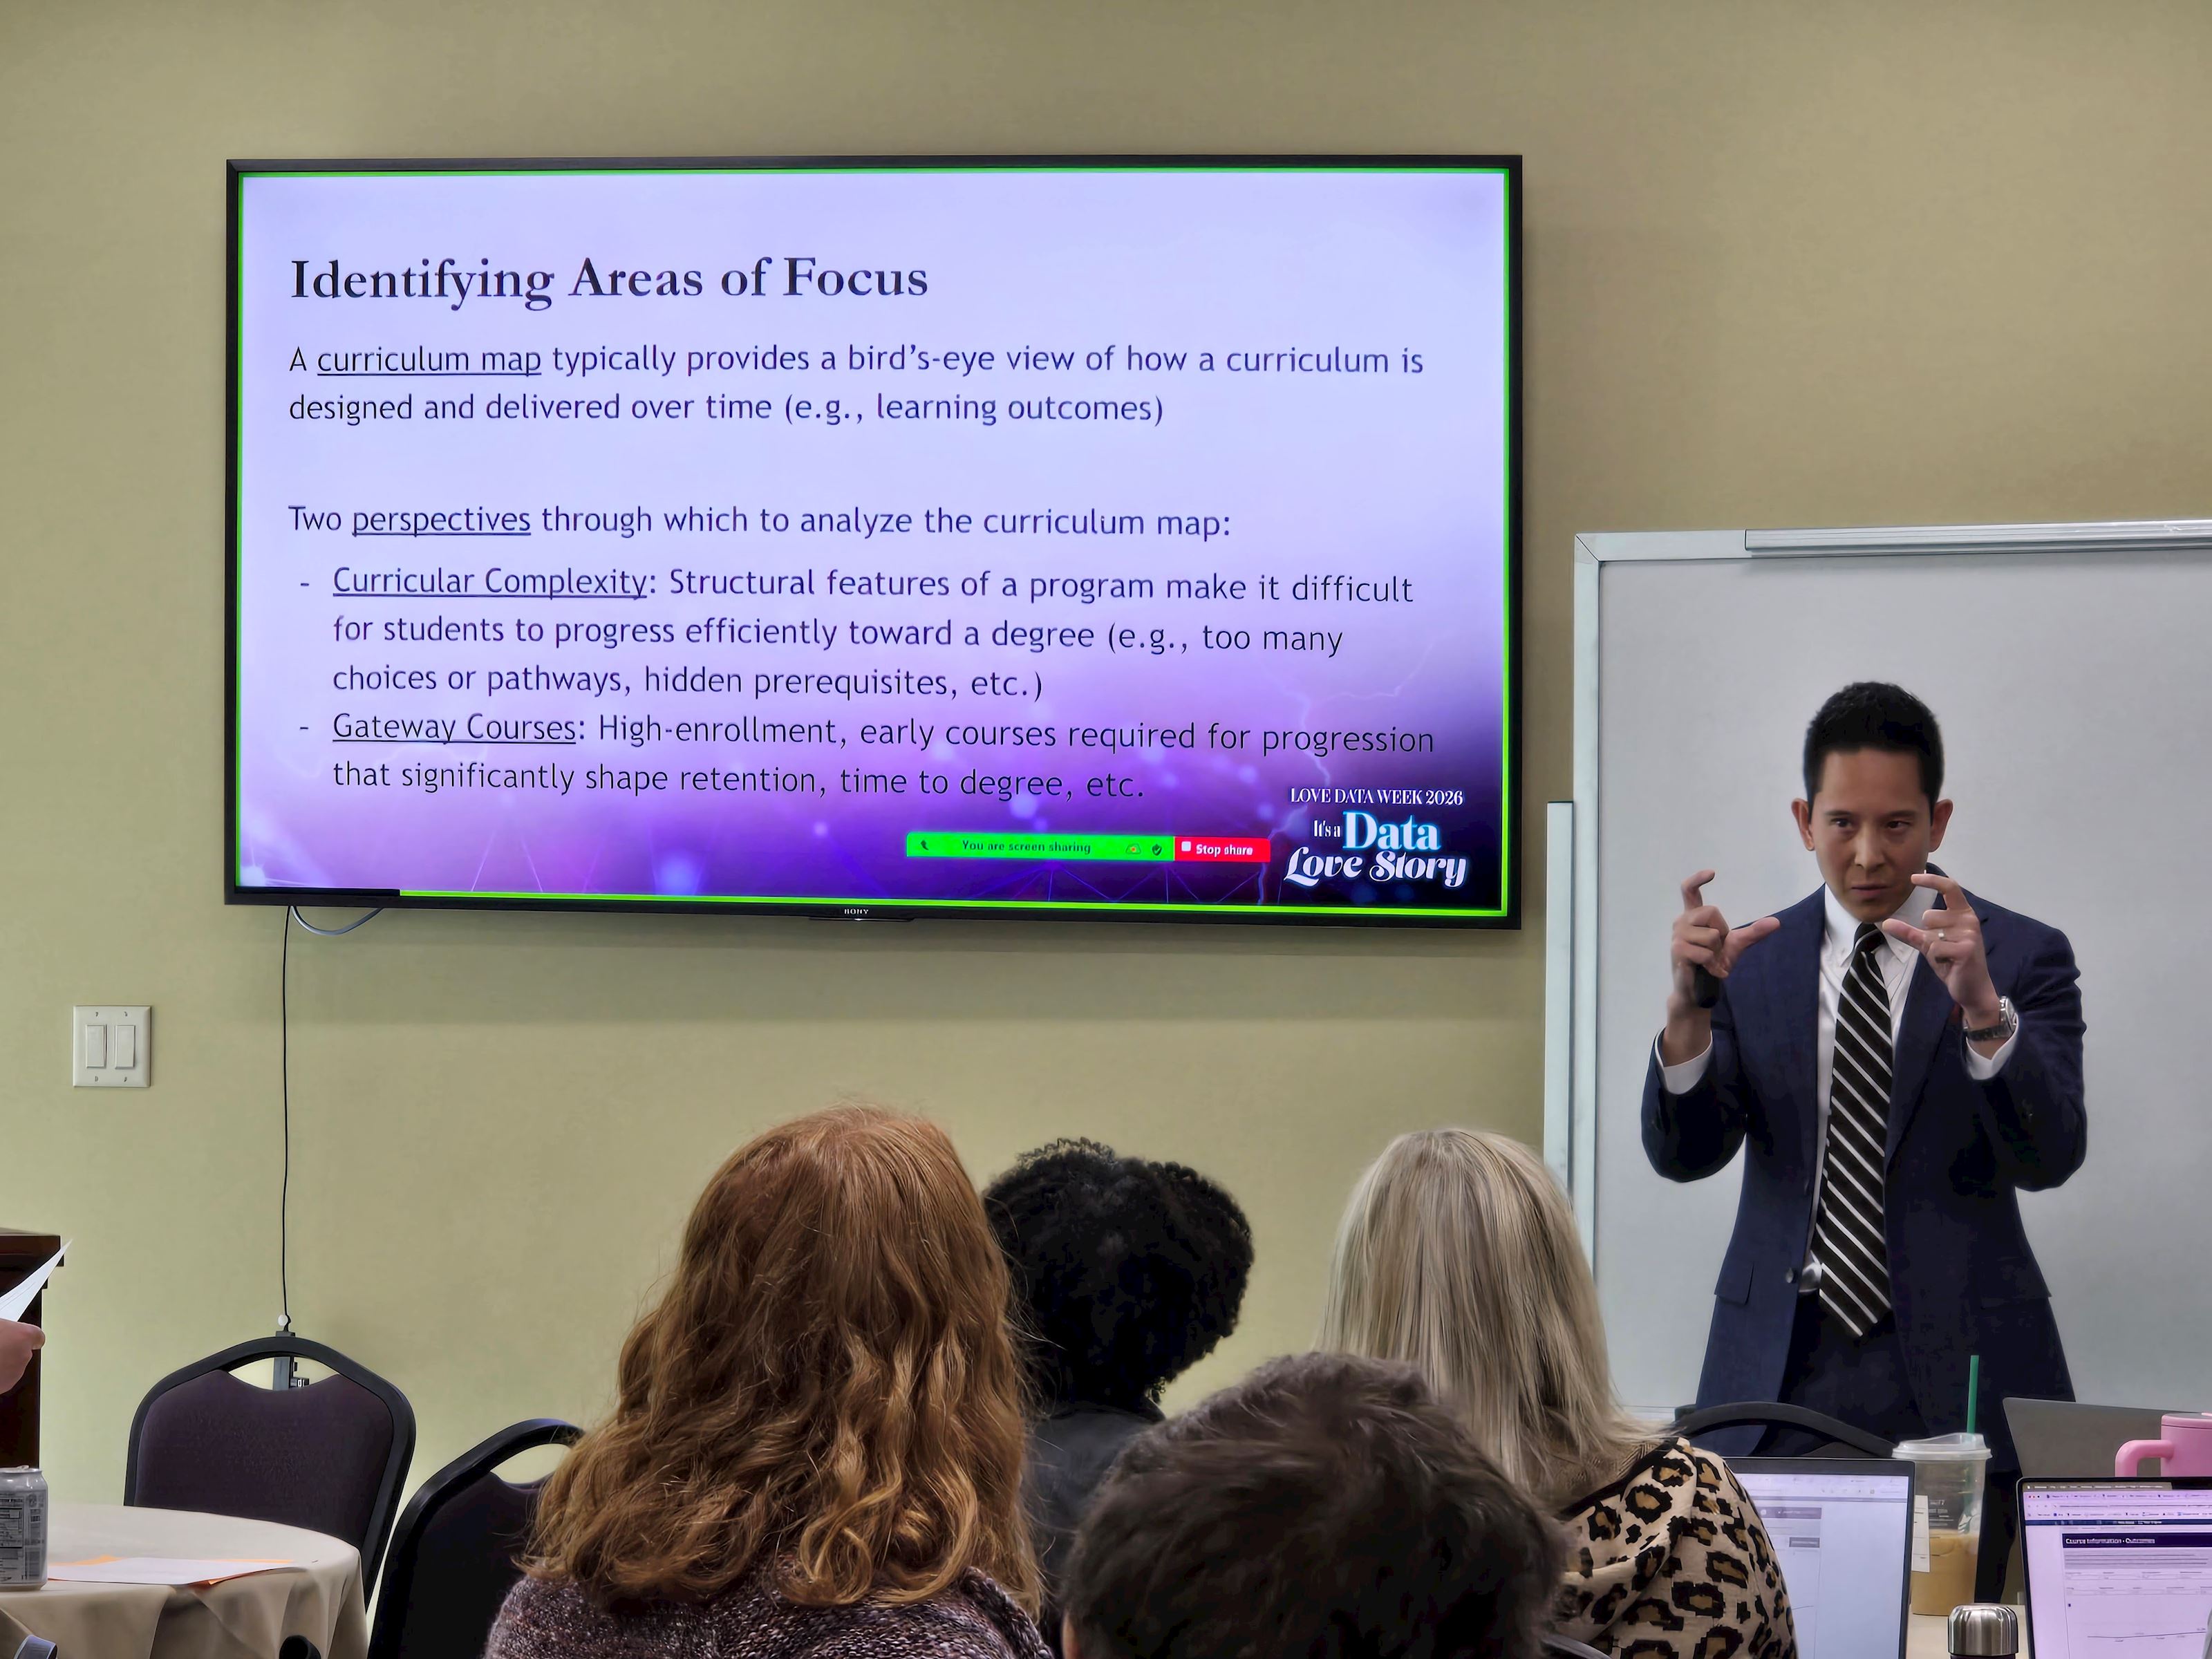
From Dashboard to Decisions: Turning First-Year Data into Action
Session Type: Workshop & Discussion
Date & Time: Feb 11 | 10:00 - 11:30 am
The session briefly showcases the Course Information dashboard that explores DFWI rates, then focuses on how those insights were used to identify math pathways and gateway courses, spark cross-campus collaboration, and launch concrete improvement work in Developmental Math.
Note: Laptops are optional
Presenters:
Daniel Jensen
Data Training & Communication Manager
Student Success Analytics
Roy Kwon
Vice Provost
Undergraduate Education, Academic Support, and Institutional Effectiveness
Matt Christiansen
Director of Developmental Math
Love at First Insight: Using Career and Workforce Data to Inform Decisions
Session Type: Virtual Presentation
Date & Time: Feb 11 | 2:00 - 3:00 pm
This session takes a closer look at the data behind Lightcast and how it is being used effectively across institutions. The session covers what makes Lightcast data different from traditional government sources, how Lightcast stays ahead of emerging trends such as skill growth, AI, green jobs, and cybersecurity, and how these insights translate into real impact.
The session also highlights best practices and practical use cases across Analyst, Career Coach, and Alumni Pathways, with a focus on driving stronger decision-making, measurable ROI, and meaningful outcomes across campus.
Presenters:
Allison Anderson
Client Success Manager
Lightcast, Labor Market Data
Crafting Your Data Story: Student Programming Dashboards & Best Practices
Session Type: Workshop
Date & Time: Feb 12 | 10:00 - 11:30 am
This session is designed for members of the Student Access and Success (SAS) division and other individuals involved in student programming who are interested in building the skills and mindset needed for Director-level decision-making.
The first portion is a guided, hands-on lab using three campus dashboards to answer practical questions about how students engage with programs, how they report their experiences at WSU, and when they are most likely to be on campus.
The second portion shifts from “using data” to “building better data” by unpacking why some SAS data is challenging to represent broadly and walking through practical examples of how standard definitions and simpler collection practices make data easier to trust, share, and use for informed decisions.
Note: Bring your laptop for this hands-on workshop and presentation.
Presenters:
Heather Chapman
Senior Director of Data & Analytics
Student Success Analytics
Leslie Park
Interim Director for Admissions Strategy/
Strategic Initiatives
Keith Yowell
Business Intelligence & Reporting Analyst
Student Success Analytics
Weber State Data is a collaborative effort among the Offices of Student Success Analytics, Institutional Research, Institutional Effectiveness and Information Technology (IT). Our goal is to serve the faculty and staff at Weber State University with high-quality data resources, tools and education, empowering our community to make data-informed decisions that support our students’ success. Learn more about our mission and check out other useful resources at weber.edu/data.
Happily Ever After With Data: Data Viz Awards & Closing Social
Session Type: Social & Celebration
Date & Time: Feb 12 | 2:00 - 4:00 pm
This informal closing social celebrates campus data work and creativity through conversation, connection, and recognition. Join colleagues for networking, light refreshments, and the announcement of the Love Data Week Data Visualization Contest winners—highlighting how data can inform, inspire, and connect the Weber State community.
This is a drop-in event, so come for a few minutes or stay for the full social. You’ll have the opportunity to chat with fellow data colleagues and leadership about dashboards, engage in some cozy, low-pressure crafting, and meet IT’s new Chief Information Officer and Associate Vice President, Rene Eborn. Let’s celebrate and close out Love Data Week together!
Hosted by the Weber State Data Teams
Presenters:
Rene Eborn
CIO & Associate Vice President of
Information Technology
Ivana Fredotovic
Chief Data Officer
Student Success Analytics
Maria Bennett
Data Governance Manager
Student Success Analytics